
NTEA is a recognized leader in providing relevant and valuable industry statistics and interpretation of market data and trends affecting the work truck industry. The Association’s comprehensive compilation and interpretation of data and forecasts is updated monthly, offering an in-depth look into the commercial vehicle market.
Members have exclusive access to a regularly updated Market Data Dashboard containing information and analysis for key industry influencers, including:
- Housing starts
- Interest rates
- Gross domestic product quarterly change
- Unemployment rate
- Consumer price index
- Fuel prices
- Commercial vehicle sales and shipments
U.S./Mexico – SALES
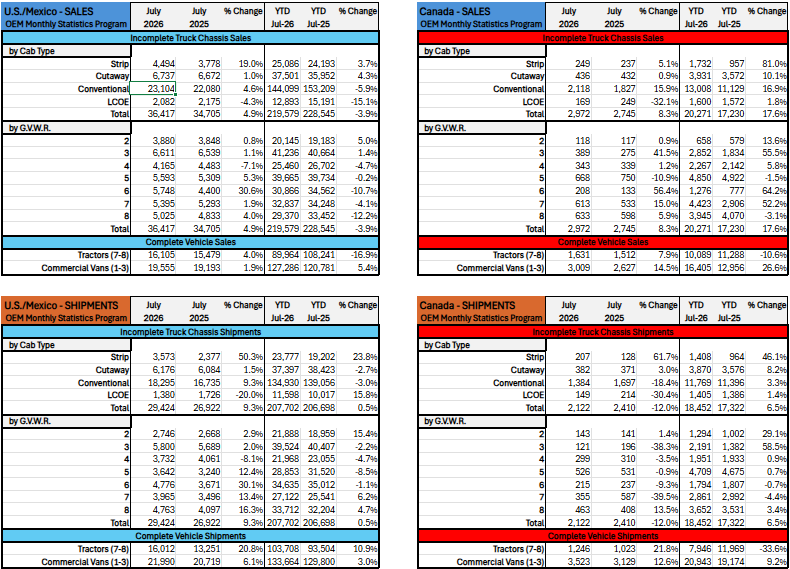
U.S./Mexico commercial truck chassis sales increased +4.9% year-over-year (YoY) in July, improving on the prior-year month even as year-to-date (YTD) sales remained down -3.9%. Complete vehicle results followed the same positive monthly direction, with Tractor sales up +4.0% and Commercial Van sales up +1.9%. The YTD trends remain notably different: vans are up +5.4%, while tractors are down -16.9%, indicating that July’s tractor improvement has not yet offset weakness earlier in the year.
Strip led U.S./Mexico cab-type sales growth in July at +19.0% YoY, while Conventional increased +4.6% and Cutaway edged up +1.0%. LCOE was the only cab type to decline, falling -4.3%. YTD results remain split: Strip and Cutaway are up +3.7% and +4.3%, respectively, while Conventional is down -5.9% and LCOE is down -15.1%. July therefore brought broader monthly improvement, but the two weaker YTD categories have not yet returned to growth.
Class 6 posted the strongest U.S./Mexico sales increase in July at +30.6% YoY, despite remaining down -10.7% YTD. Class 5 rose +5.3% and is nearly even YTD at -0.2%. Classes 8 and 7 increased +4.0% and +1.9% for the month but remained below prior-year levels YTD, while Classes 2 and 3 recorded modest gains in both comparisons. Class 4 was the only class to decline in July, down -7.1%, and also remained lower YTD at -4.7%. The monthly improvement was therefore broad, but not yet equally established across the YTD results.
U.S./Mexico – SHIPMENTS
U.S./Mexico truck chassis shipments increased +9.3% YoY in July, moving the YTD comparison slightly into positive territory at +0.5%. Complete vehicle shipments were also stronger: Tractor shipments rose +20.8% for the month and +10.9% YTD, while Commercial Van shipments increased +6.1% in July and +3.0% YTD. With shipments positive in both timeframes while chassis sales remain lower YTD, production activity is currently running ahead of the cumulative sales trend.
Strip posted the strongest U.S./Mexico cab-type shipment growth in July at +50.3% YoY, followed by Conventional at +9.3% and Cutaway at +1.5%. LCOE moved in the opposite direction, declining -20.0%. The YTD pattern differs from the latest month: Strip and LCOE are up +23.8% and +15.8%, respectively, while Conventional is down -3.0% and Cutaway is down -2.7%. July strengthened the shipment picture overall, but the leading and lagging cab types vary considerably by timeframe.
U.S./Mexico shipment growth extended across most GVWR classes in July. Class 6 led at +30.1% YoY, followed by Class 8 at +16.3%, Class 7 at +13.4%, and Class 5 at +12.4%; Classes 2 and 3 also increased. Class 4 was the only monthly decline at -8.1%. YTD, Classes 2, 7, and 8 remained above prior-year levels, while Classes 3 through 6 remained lower. Class 5’s strong July gain contrasts with its -8.5% YTD result, making it one of the clearest monthly-versus-cumulative reversals.
Canada – SALES
Canadian commercial truck chassis sales increased +8.3% YoY in July and remained strong at +17.6% YTD. Commercial Van sales continued to outperform, rising +14.5% for the month and +26.6% YTD. Tractor sales also improved +7.9% in July, but remained down -10.6% YTD. Canada’s sales picture is therefore positive overall, although the complete vehicle categories continue to show different levels of cumulative momentum.
Conventional led Canadian cab-type sales growth in July at +15.9% YoY, while Strip increased +5.1% and Cutaway was nearly level at +0.9%. LCOE declined -32.1%, standing apart from the other cab types. By GVWR, Class 6 rose +56.4%, Class 3 increased +41.5%, and Class 7 gained +15.0%. Classes 2, 4, and 8 posted smaller increases, while Class 5 declined -10.9%. YTD sales remained positive across most categories, with Class 5 slightly lower at -1.5% and Class 8 down -3.1%.
Canada – SHIPMENTS
Canadian truck chassis shipments declined -12.0% YoY in July, moving opposite the region’s positive sales result for the month. Shipments nevertheless remained up +6.5% YTD, reflecting stronger activity earlier in 2026. Complete vehicles followed a different monthly direction: Tractor shipments increased +21.8% and Commercial Van shipments rose +12.6%. The YTD contrast remains substantial, with tractors down -33.6% and vans up +9.2%.
By cab type, Canadian Strip shipments increased +61.7% YoY in July and Cutaway rose +3.0%, while Conventional declined -18.4% and LCOE fell -30.4%. By GVWR, Class 8 increased +13.5% and Class 2 edged up +1.4%; Classes 3 through 7 declined, led by Class 7 at -39.5% and Class 3 at -38.3%. The YTD direction remains more favorable: Classes 2, 3, 4, 5, and 8 are above 2025, while Classes 6 and 7 are modestly below.
Summary Insights
July’s clearest change was the improvement in U.S./Mexico shipments: a +9.3% monthly gain moved the YTD comparison above 2025 for the first time in this reporting sequence. Sales also improved, but remain lower YTD, so whether demand absorbs the additional flow of chassis bears watching. Canada presents the reverse near-term signal: sales are expanding while July chassis shipments pulled back, although its YTD results remain positive. Across both regions, Commercial Vans continue to show the most consistent growth. Tractors improved in July, but weak cumulative sales in both markets and the steep Canadian shipment deficit indicate that the segment has not yet established the same momentum.
NTEA members can view additional information and insights in the Market Data Dashboard, which is updated monthly (login required). Not sure if you’re a member? Check your status, join today, or contact us for assistance (info@ntea.com or 248-489-7090).