NTEA is a recognized leader in providing relevant and valuable industry statistics and interpretation of market data and trends affecting the work truck industry. The Association’s comprehensive compilation and interpretation of data and forecasts is updated monthly, offering an in-depth look into the commercial vehicle market.
Members have exclusive access to a regularly updated Market Data Dashboard containing information and analysis for key industry influencers, including:
- Housing starts
- Interest rates
- Gross domestic product quarterly change
- Unemployment rate
- Consumer price index
- Fuel prices
- Commercial vehicle sales and shipments
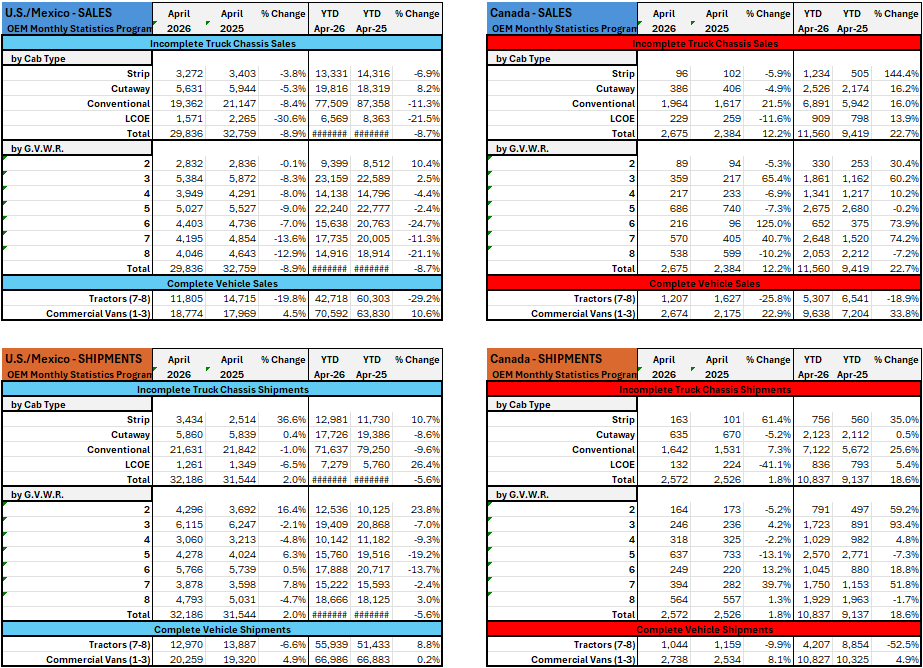
U.S./Mexico – SALES
U.S./Mexico commercial truck chassis sales decreased -8.9% year-over-year (YoY) in April 2026 compared to April 2025. Year-to-date (YTD) sales are down -8.7%. Complete vehicle results were mixed but softer overall, with Tractor sales down -19.8% YoY and -29.2% YTD, while Commercial Van sales increased +4.5% YoY and are up +10.6% YTD.
By cab type, all four configurations declined year-over-year. Strip sales were down -3.8% and Cutaway declined -5.3%, while Conventional fell -8.4%. LCOE posted the sharpest decline at -30.6% YoY and is down -21.5% YTD. The YTD view remains uneven, with Cutaway still positive through April at +8.2%, while Strip, Conventional, and LCOE remain below prior-year levels.
By GVWR, April sales were negative across every class, although the magnitude varied. Class 2 was essentially flat at -0.1% YoY, while Classes 3, 4, 5, and 6 declined between -7.0% and -9.0%. The largest monthly declines were in Class 7, down -13.6%, and Class 8, down -12.9%. YTD results show relative strength in Classes 2 and 3, up +10.4% and +2.5%, respectively, while Classes 6, 7, and 8 remain down materially.
U.S./Mexico – SHIPMENTS
Truck chassis shipments in the U.S./Mexico region increased +2.0% YoY in April 2026, although YTD shipments remain down -5.6%. Complete vehicle shipments were mixed, with Tractor shipments down -6.6% YoY but still up +8.8% YTD, while Commercial Van shipments increased +4.9% YoY and are nearly flat YTD at +0.2%.
Cab type results were mixed. Strip shipments posted the strongest gain, rising +36.6% YoY and +10.7% YTD. Cutaway was nearly flat, up +0.4% YoY, while Conventional declined -1.0% and LCOE fell -6.5%. Despite the monthly decline, LCOE remains up +26.4% YTD, while Cutaway and Conventional remain below prior-year levels through April.
By GVWR, shipment results were uneven but generally firmer than sales. Class 2 shipments increased +16.4% YoY, followed by Class 7 at +7.8% and Class 5 at +6.3%. Class 6 was essentially flat at +0.5%. Classes 3, 4, and 8 declined, with Class 8 down -4.7% YoY. YTD results remain mixed, with Classes 2 and 8 positive, while Classes 3 through 7 remain negative.
Canada – SALES
Canadian commercial truck chassis sales increased +23.7% YoY in March 2026, with YTD sales up +26.3%. Complete vehicle sales were mixed, with Tractor sales down -33.4% YoY and -16.6% YTD, while Commercial Van sales increased +53.6% YoY and are up +38.5% YTD.
By cab type, all four configurations increased year-over-year. LCOE and Cutaway led the market, rising +41.8% and +40.1% YoY, respectively, followed by Conventional at +16.6% and Strip at +7.2%. YTD results were also positive across all cab types, with Strip up +182.4%, though that unusually large increase was supported by a much lighter prior-year comparison base.
By GVWR, most classes moved higher. Class 2 sales increased +207.9% YoY, reflecting a lighter prior-year comparison base, while Class 6 rose +70.1%, Class 7 increased +54.3%, and Class 3 gained +50.6%. Classes 4 and 5 also posted gains, up +40.6% and +5.0%, respectively. Class 8 was the only weight class to decline, down -20.1% YoY and -6.1% YTD. Overall, Canada’s sales results remained constructive in March, with gains spread across most cab types and weight classes, supported especially by Commercial Van activity and selected lighter- and medium-duty segments.
Canada – SHIPMENTS
Canadian truck chassis shipments increased +1.8% YoY in April 2026 and are up +18.6% YTD. Complete vehicle shipments were mixed, with Tractor shipments down -9.9% YoY and -52.5% YTD, while Commercial Van shipments increased +8.1% YoY and are up +4.9% YTD.
By cab type, shipment results were mixed. Strip posted the largest increase, rising +61.4% YoY, followed by Conventional at +7.3%. Cutaway declined -5.2%, and LCOE fell -41.1% YoY. The YTD view remains positive across all four cab types, but April shows that the monthly growth was concentrated in Strip and Conventional rather than broadly distributed.
By weight class, the strongest April gains were in Class 7, up +39.7% YoY, and Class 6, up +13.2%. Class 3 increased +4.2% and Class 8 rose +1.3%. Classes 2, 4, and 5 declined, with Class 5 down -13.1%. YTD results remain positive in most classes, particularly Classes 3, 2, and 7, while Classes 5 and 8 are down modestly through April.
By GVWR, gains were concentrated in selected medium-duty classes. Class 6 sales increased +125.0% YoY, followed by Class 3 at +65.4% and Class 7 at +40.7%. Classes 2, 4, 5, and 8 declined year-over-year, with Class 8 down -10.2%. YTD results remain positive for most classes, especially Classes 3, 6, and 7, while Classes 5 and 8 are slightly below prior-year levels.
Summary Insights
April results point to a more uneven North American chassis market than March. U.S./Mexico sales softened noticeably, with declines across all cab types and GVWR classes, while shipments remained slightly positive for the month despite a still-negative YTD comparison. Commercial Van activity continued to outperform Tractor activity in both regions, especially in Canada. Canada remained positive overall in sales and shipments, supported by Commercial Vans and selected medium-duty classes, but its April gains were less broad than March. In short, April data suggests continued resilience in shipments and Canadian demand, but the sales side of the U.S./Mexico market weakened, and the broader YTD picture remains mixed.
NTEA members can view additional information and insights in the Market Data Dashboard, which is updated monthly (login required). Not sure if you’re a member? Check your status, join today, or contact us for assistance (info@ntea.com or 248-489-7090).