By Steve Latin-Kasper, NTEA Senior Director of Market Data & Research
Meet our experts
This article was published in the May 2021 edition of NTEA News
 Key highlights
- U.S. Potential Sales can help industry companies determine market share, assign sales regions and measure sales performance.
- The digital component of this resource can be modified to represent product markets.
- Examples used in this article demonstrate how the model can be adjusted to determine market size by state and application market for walk-in van and crane bodies.
Every three years, NTEA publishes new editions of U.S. Potential Sales of Work Trucks and Truck Equipment by Geographic Market. This resource helps companies determine potential product sales to 106 application (end-use) markets in all 50 states and 383 metropolitan statistical areas. The print portion represents the entire industry, while the digital component functions as an econometric model that can be modified to represent product markets.

The most recent edition was published in 2019 with data from 2016 (the next version will be released in 2022). It’s important to note the current edition is just as useful now as when first issued — dollar data in the publication can be updated using NTEA’s Annual Manufacturers’ Shipments Survey or contact Steve Latin-Kasper directly.
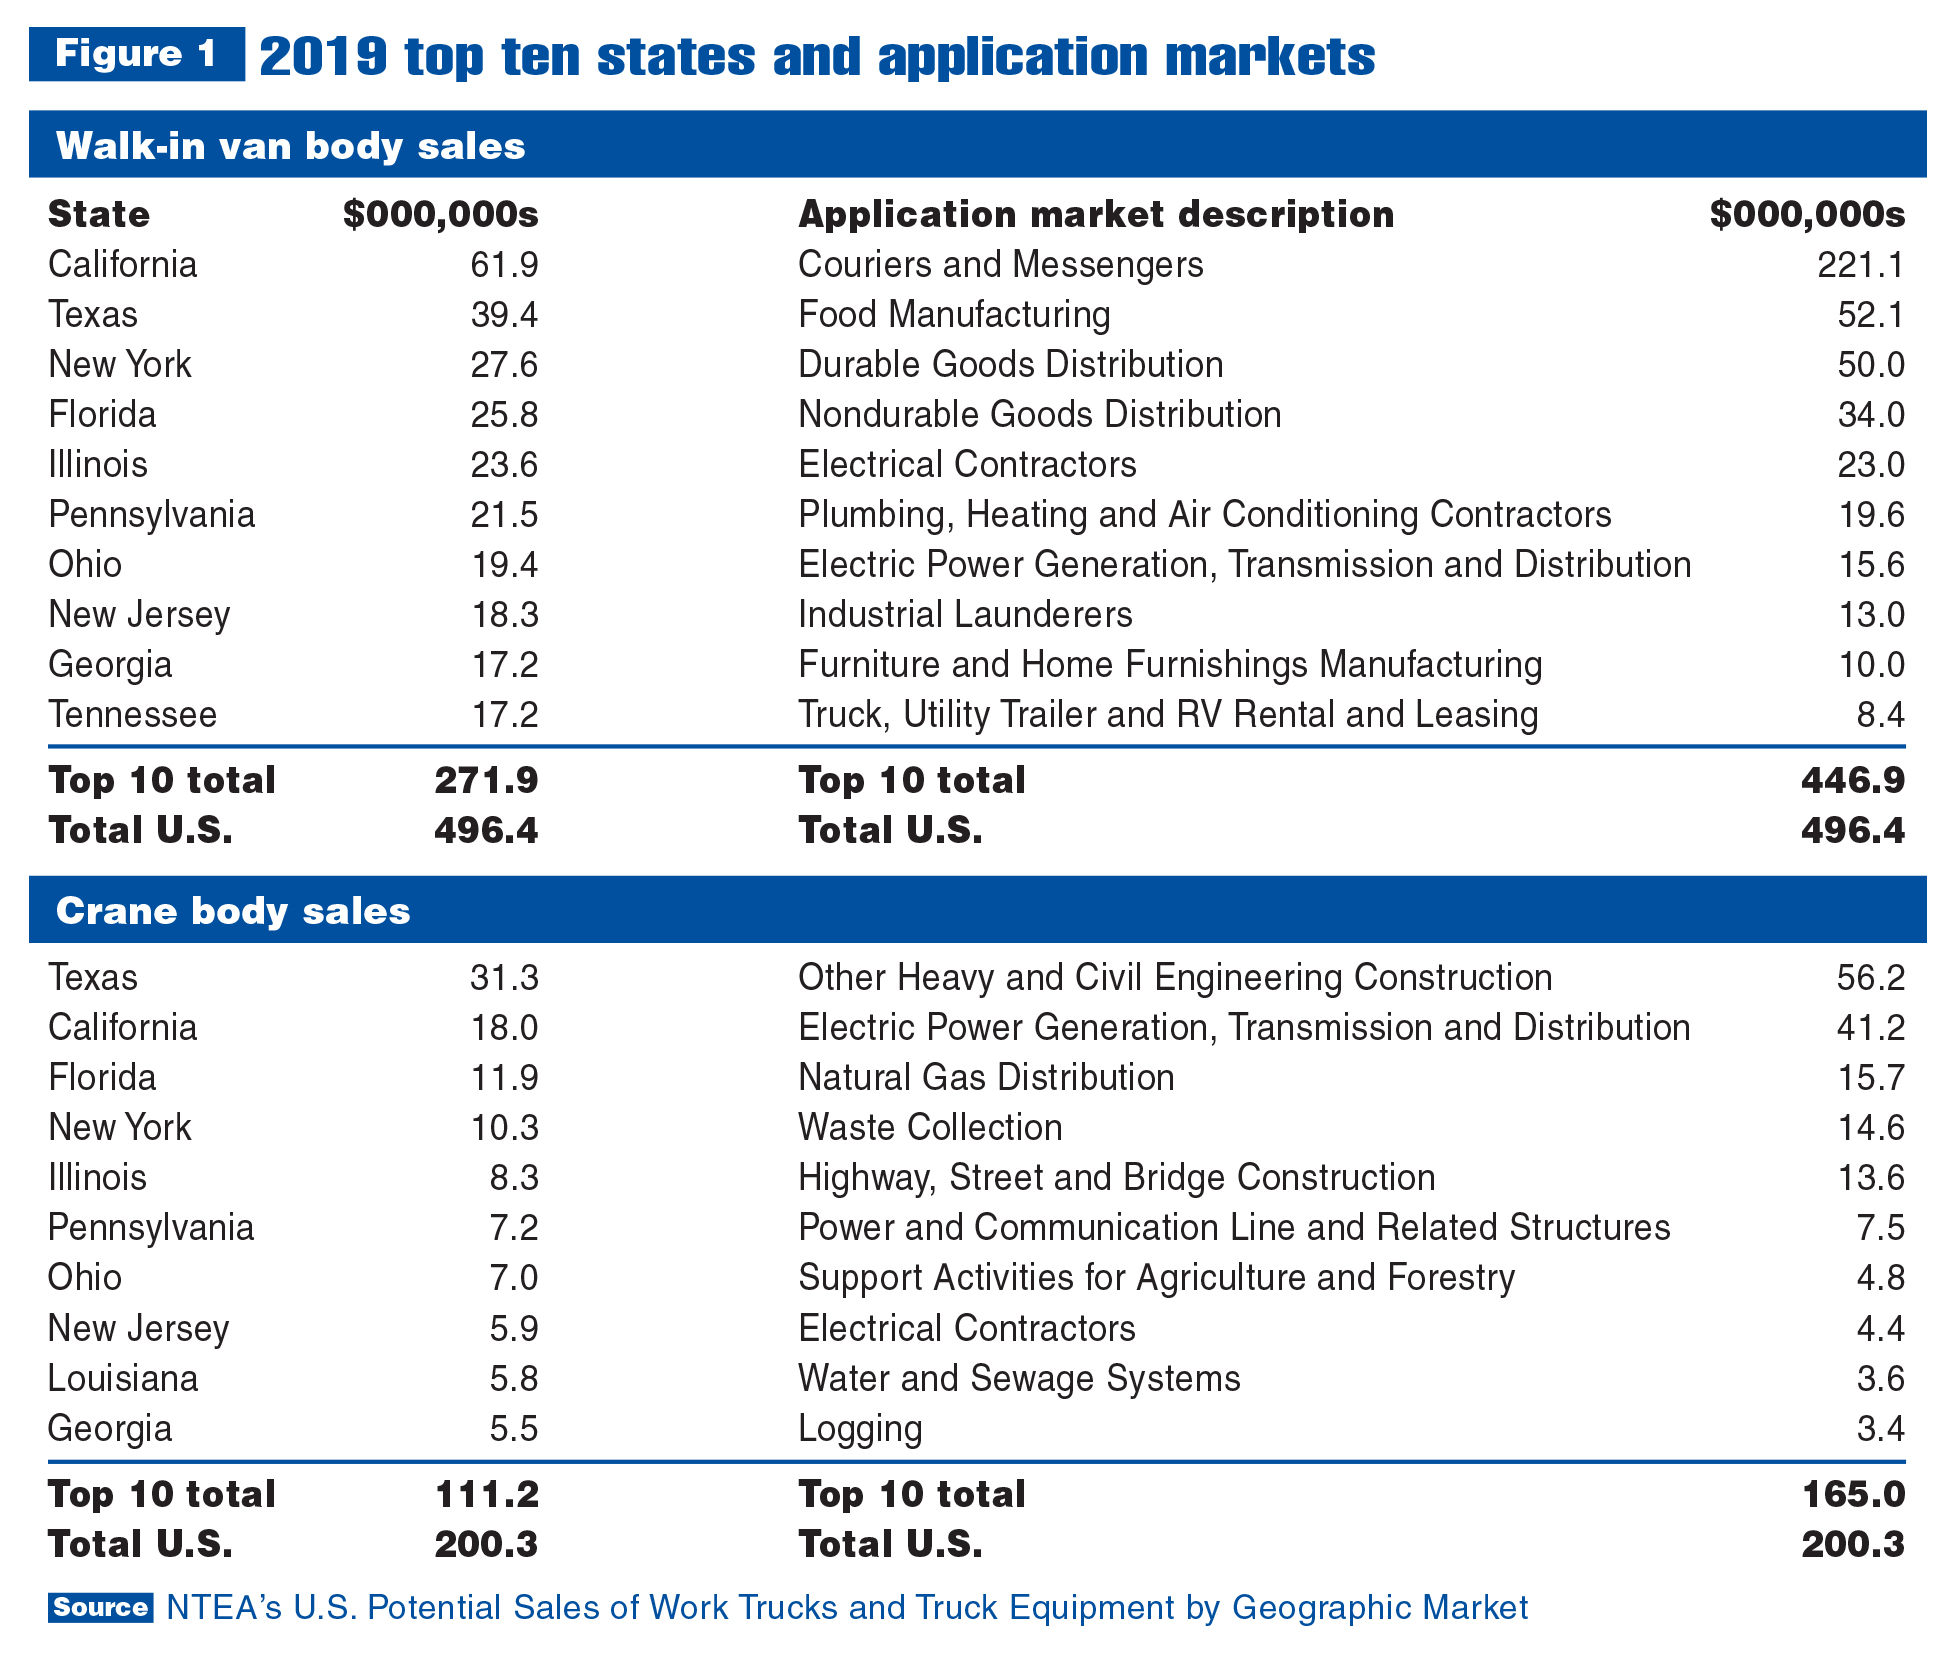
In Figures 1 and 2, data from NTEA’s 2019 Annual Manufacturers’ Shipments Survey was entered into the potential sales model to update dollar totals. This helps demonstrate how the model can be adjusted to determine market size by state and application market for walk-in van and crane bodies.
In the print version of U.S. Potential Sales, totals for states and metropolitan areas represent total industry sales to each market. However, calculations determining market size in each location depend on industry weights. The weights applied for the total industry are different from those needed for specific body and equipment types.
To create Figure 1, application market weights and market size totals relevant to walk-in van and crane bodies were applied to the model to demonstrate how it can be used to prioritize sales resource utilization. On a state-by-state basis, nine of the top 10 states are the same, but their total sales shares vary. (Keep in mind, top-10 state lists will look similar for many body/equipment types because larger markets tend to have the highest populations.) In this example, data indicates walk-in van body manufacturers/distributors could consider devoting more sales resources to California than Texas. For crane body manufacturers/distributors, it’s just the opposite.
Unlike state top-10 lists, application market top-10 lists differ substantially, as could be expected. Only two markets appear on both lists. A noteworthy similarity between walk-in van and crane body application market lists, though, is the top 10 markets account for a majority of the U.S. total in both. The model clearly identifies which application markets deserve prioritization in absolute and relative terms.
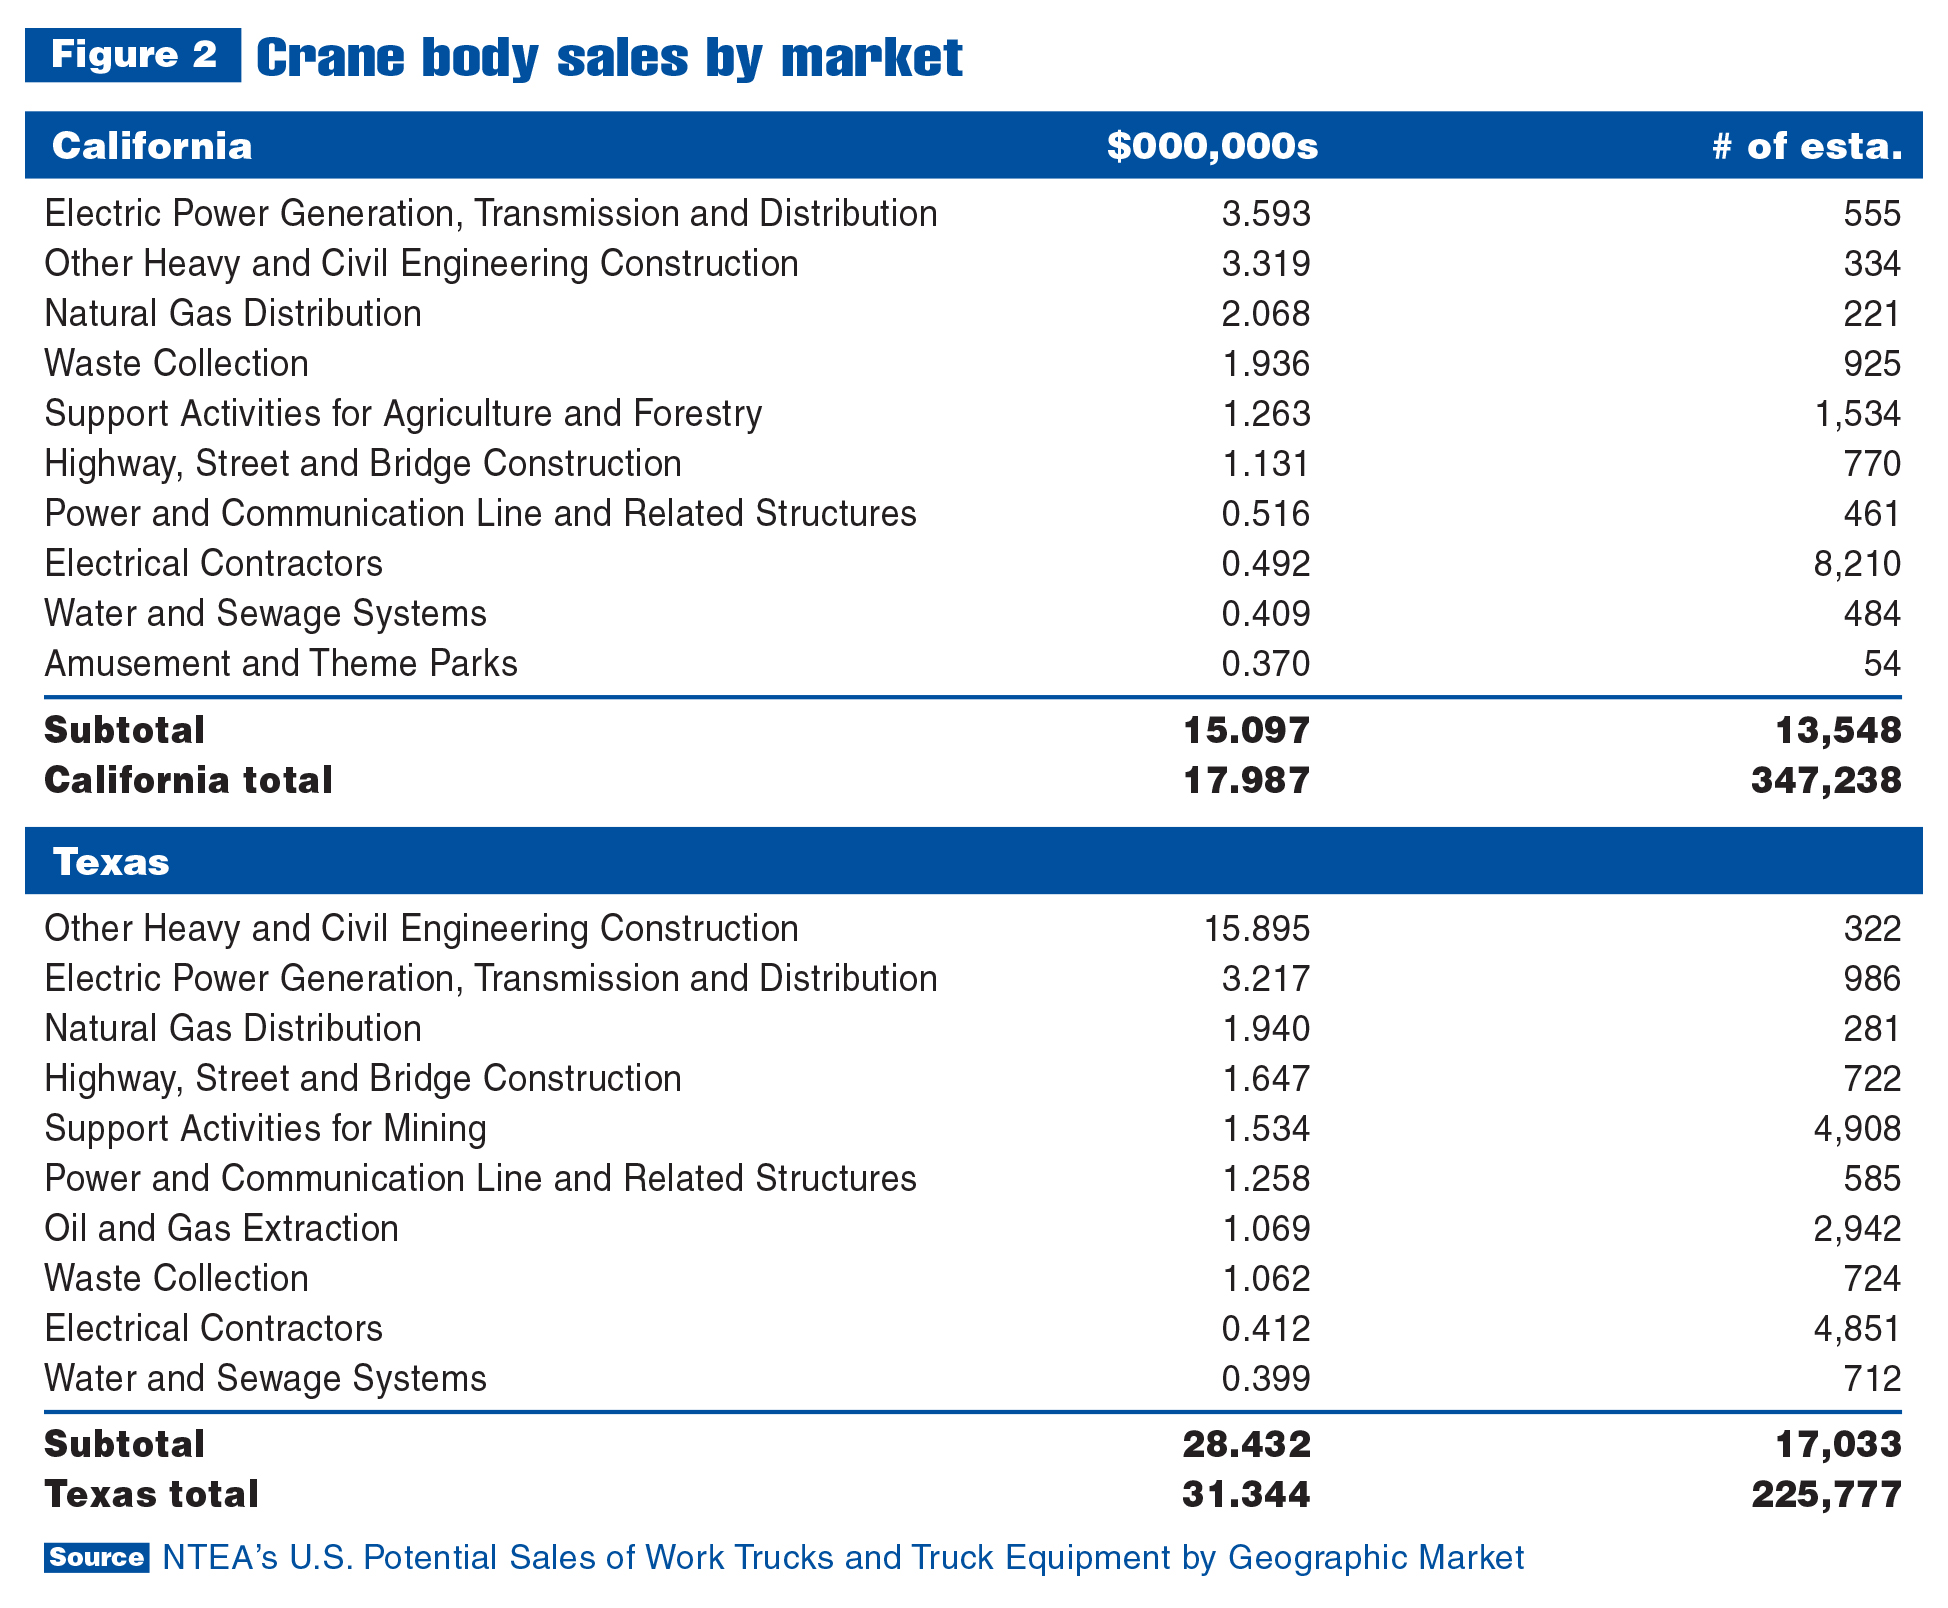
It’s been said there are three rules to follow when market planning: segmentation, segmentation and segmentation. In Figure 1, state and application market data are independent of each other. In Figure 2, data represents total crane body sales by state, by application market. As could be anticipated, state top-10 application market lists are similar — California has only two markets that do not appear on Texas’s list. However, there are substantial differences, such as the size of the Other Heavy and Civil Engineering Construction market in each state, which accounts for most of the absolute difference in total sales. Beyond that, relative differences in the two lists, in terms of dollars, and number of establishments are important for market planning in general, and sales resource assignation in particular.
The U.S. Potential Sales model can be used by all NTEA members, as demonstrated in this article. And it works just as well for different types of truck equipment as for bodies. If you have additional questions on how this resource applies to your business, email me at stevelk@ntea.com.
Visit ntea.com/potentialsales for more information and to purchase.