By Doyle Sumrall, NTEA Managing Director
This article was published in the December 2017 edition of NTEA News
We live in a data-centric society — receiving a constant flow via news outlets, social media, and many other sources. NTEA understands the importance of such information for effective business planning, strategic analysis and decision-making.
Each year, the Association brings together a group of thought-provoking speakers for the Executive Leadership Summit, a conference designed to bring perspective to economic and business trends influencing work truck industry companies. The 2017 Summit, held in October in Chicago, Illinois, featured presentations from leading experts in various fields, including NTEA staff.
Our economist, Steve Latin-Kasper, shared a macroeconomic overview — relating it to key commercial truck market indicators. NTEA Executive Director Steve Carey and I presented results of recent NTEA studies as well as upcoming issues upfitters will face. The core thread that ran through these Association presentations was vocational data. This article shares some of the highlights.
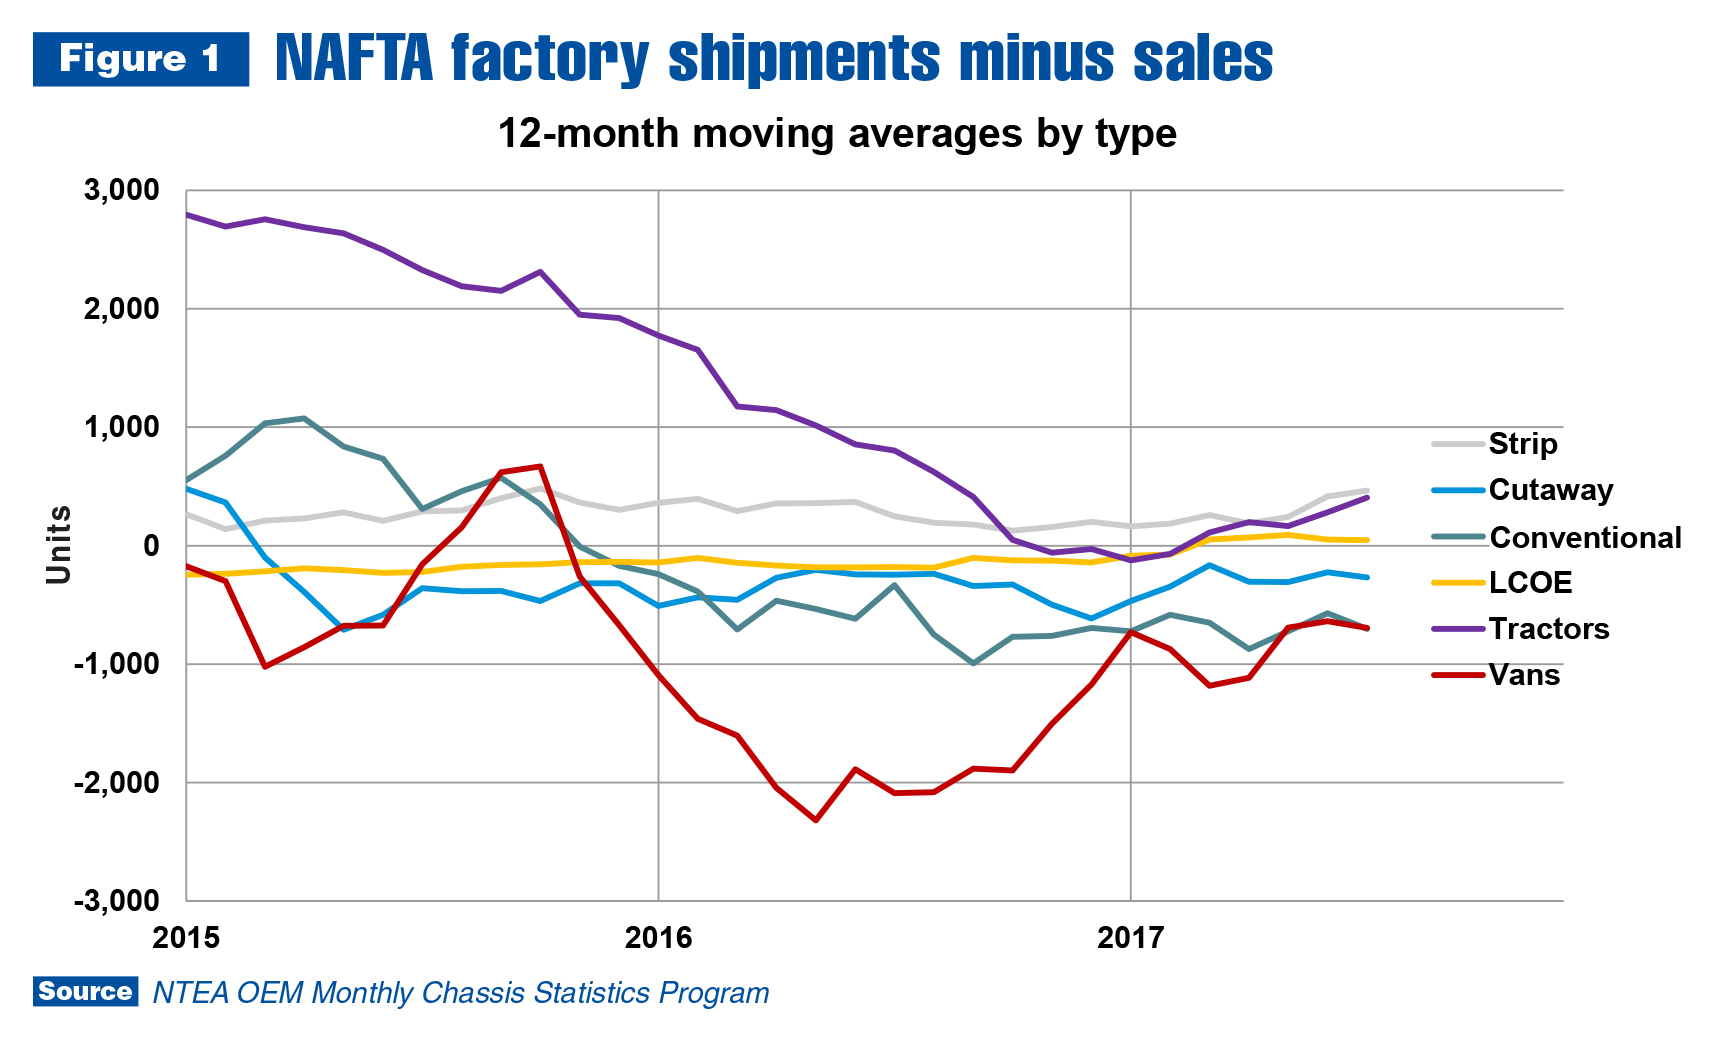
OEM Monthly Chassis Report — which offers analysis into the monthly box-off truck chassis shipments and sales data provided by OEMs — is a key resource NTEA members receive each month. It includes various trend elements, one of which is NAFTA factory shipments minus sales (as shown in Figure 1), which I reviewed during our presentation. This chart illustrates patterns and fluctuations in the available inventory of truck chassis types to aid in planning processes.
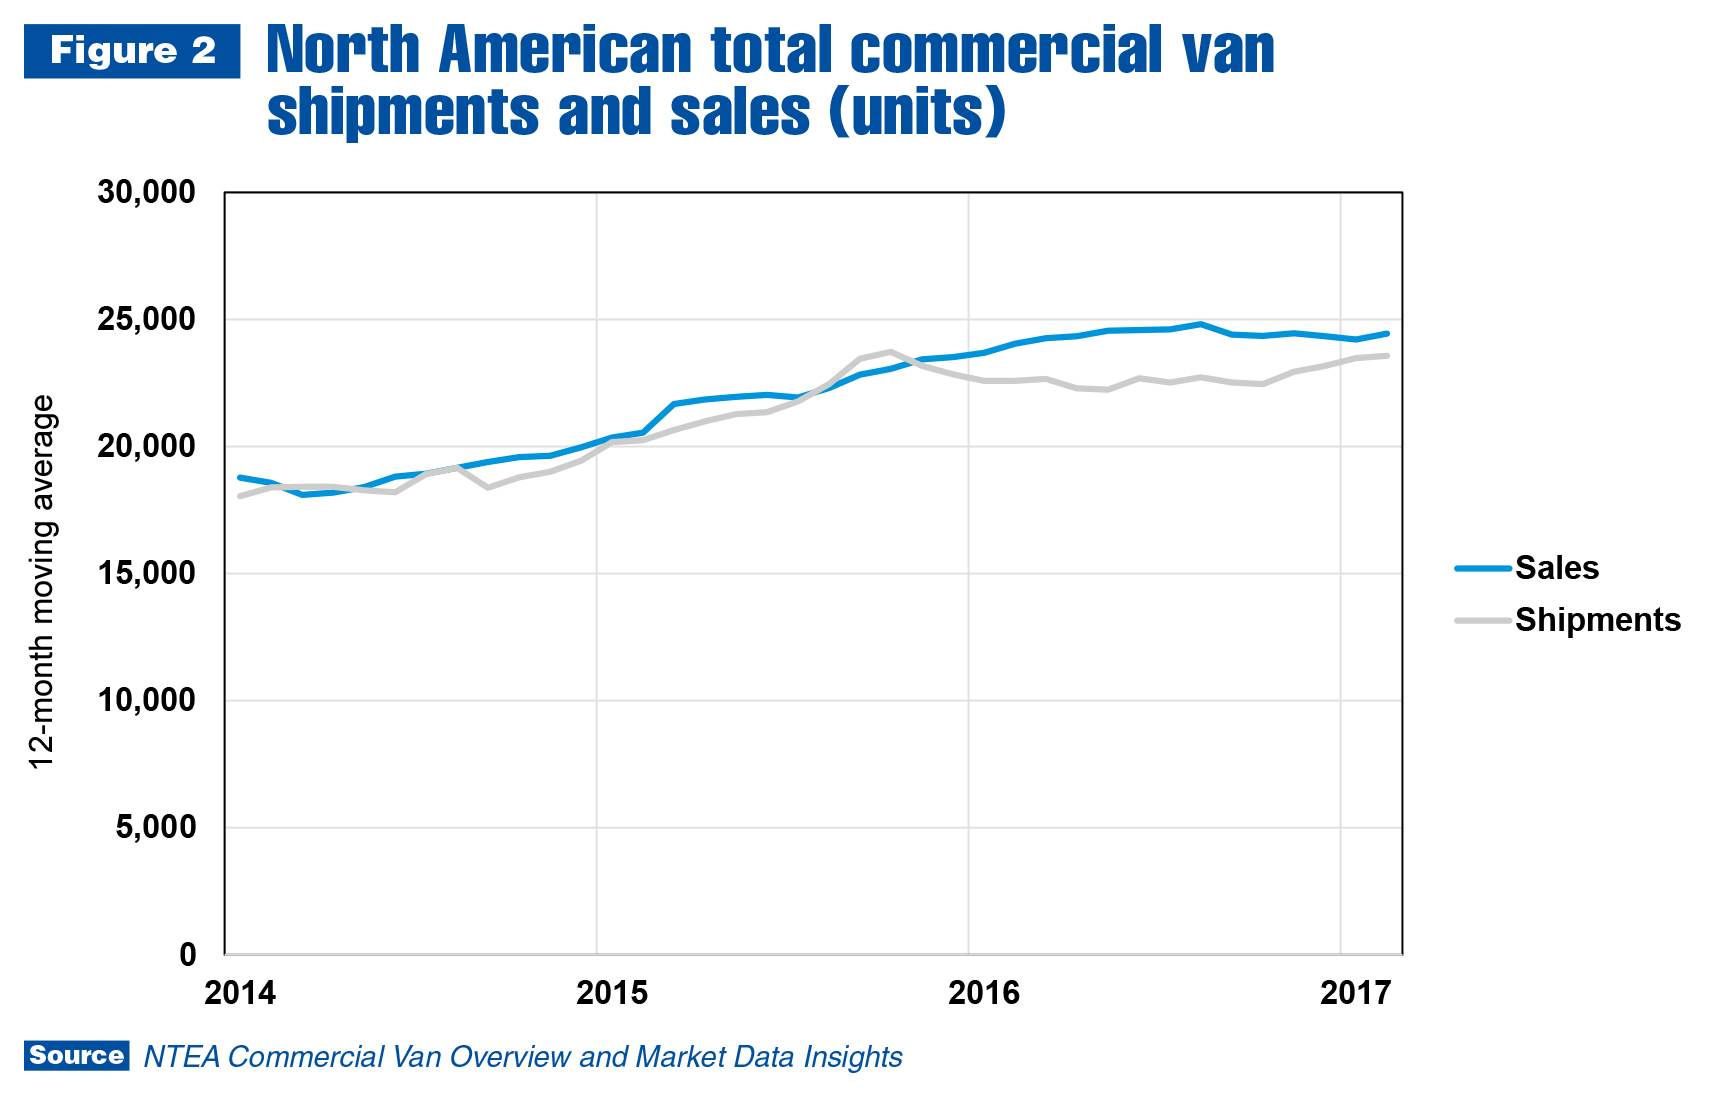
Another element in OEM Report is van data. This chassis type has been moving to the forefront the past few years, with customer configuration preferences evolving. As shared at the Summit, Figure 2 shows the sales increase and corresponding growth in van shipments as reported to NTEA by producing chassis OEMs. This indicates mid- to late-2016 inventories tightened, and chassis manufacturers are moving to close the gap. NTEA recently hosted a webinar offering additional insights into the North American commercial van market (ntea.com/webinars) and produced a report on this popular vehicle segment (ntea.com/commercialvanreport).
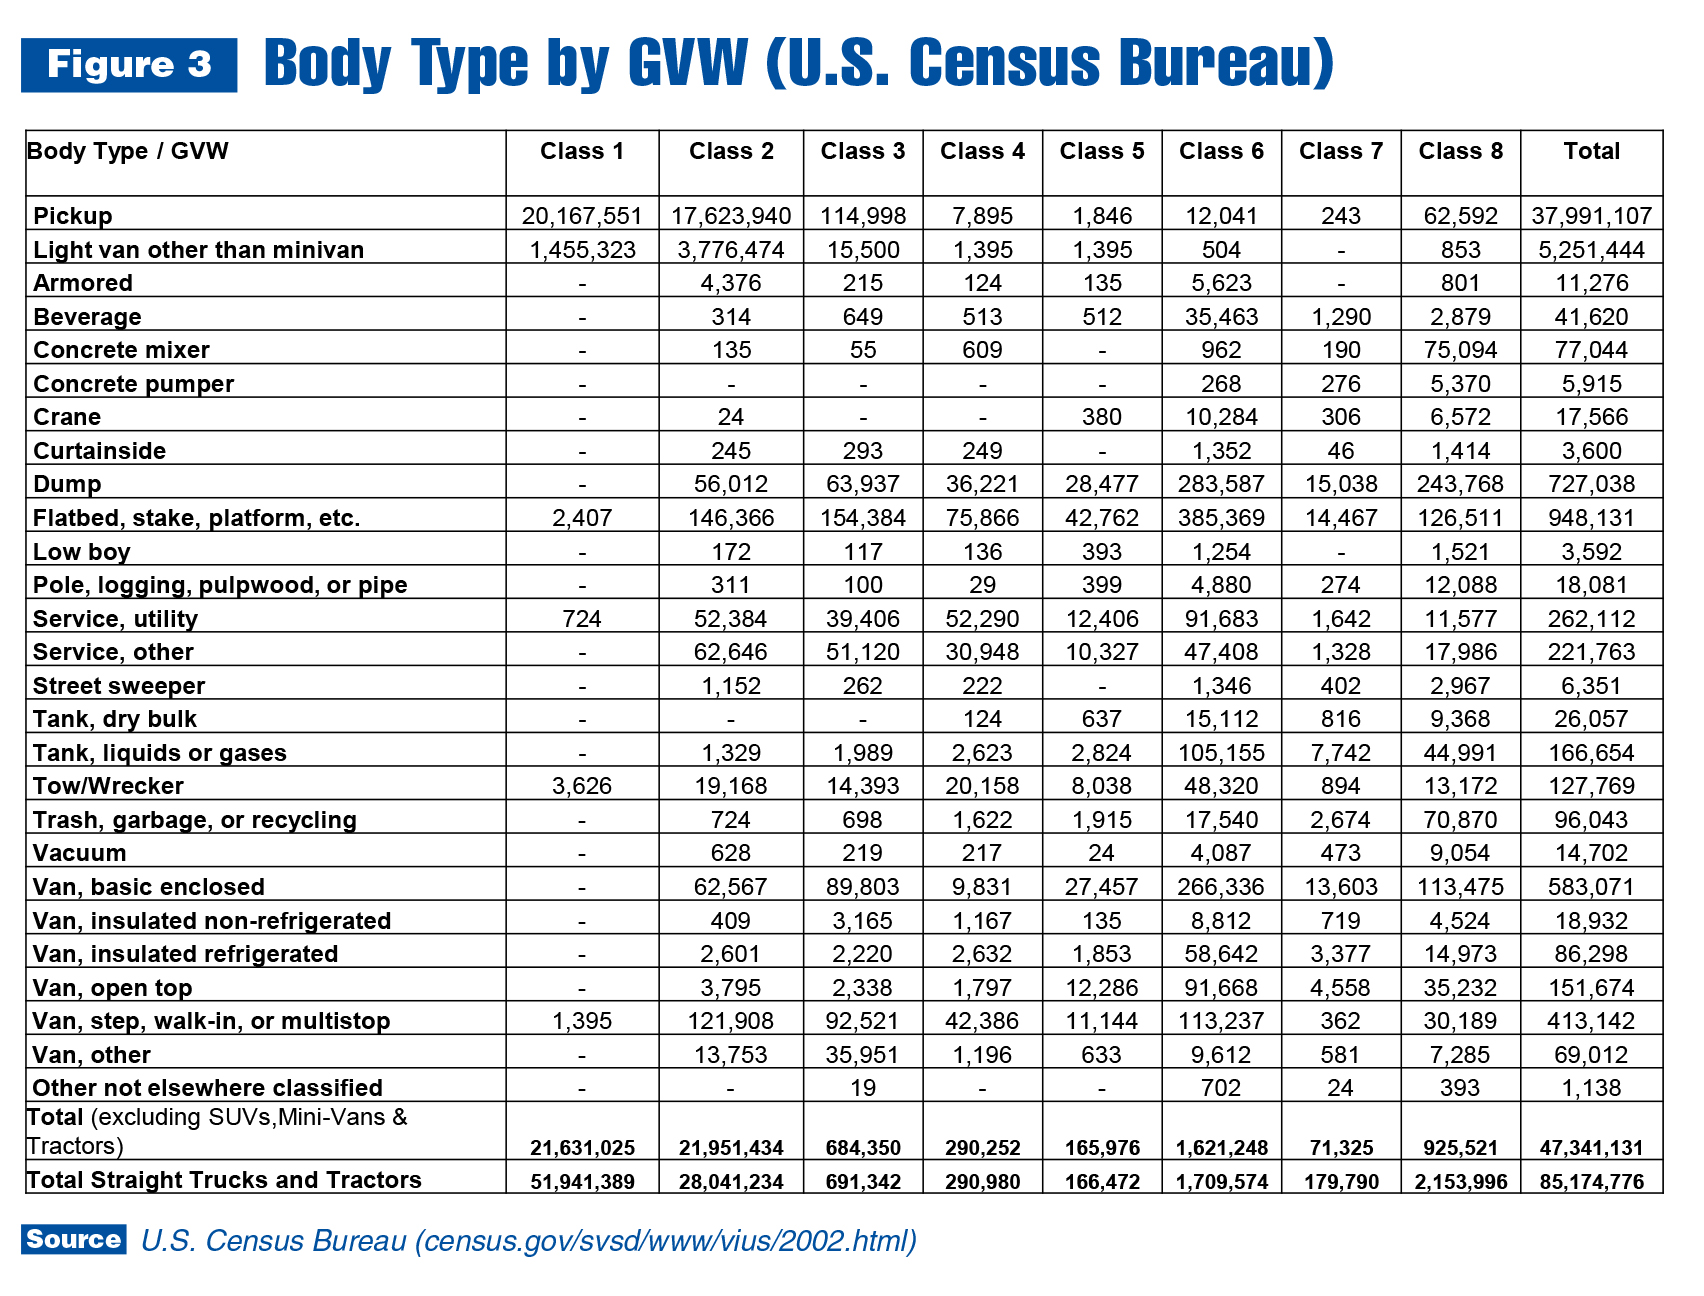
Industry companies are increasingly seeking solid data on vocational configurations of the work truck population as well as chassis and upfit trends. The mainstay for vocational data has always been the Vehicle Inventory and Use Survey compiled by U.S. Census Bureau in 2002 and reported in 2005. While this is an older resource, which has some known issues in its Class 5–7 truck statistics, it’s definitive and serves as a foundation for vocational data today.
With more than 144 million Class 1–8 trucks in use in 2015, significant opportunities exist. The in-use population is a huge parts and retrofit market, and with average age ranging from 10–18 years, new truck replacement demand should continue. In addition, 51 percent total population growth from 2002–2015 clearly indicates the vocational market is on a continued growth path.
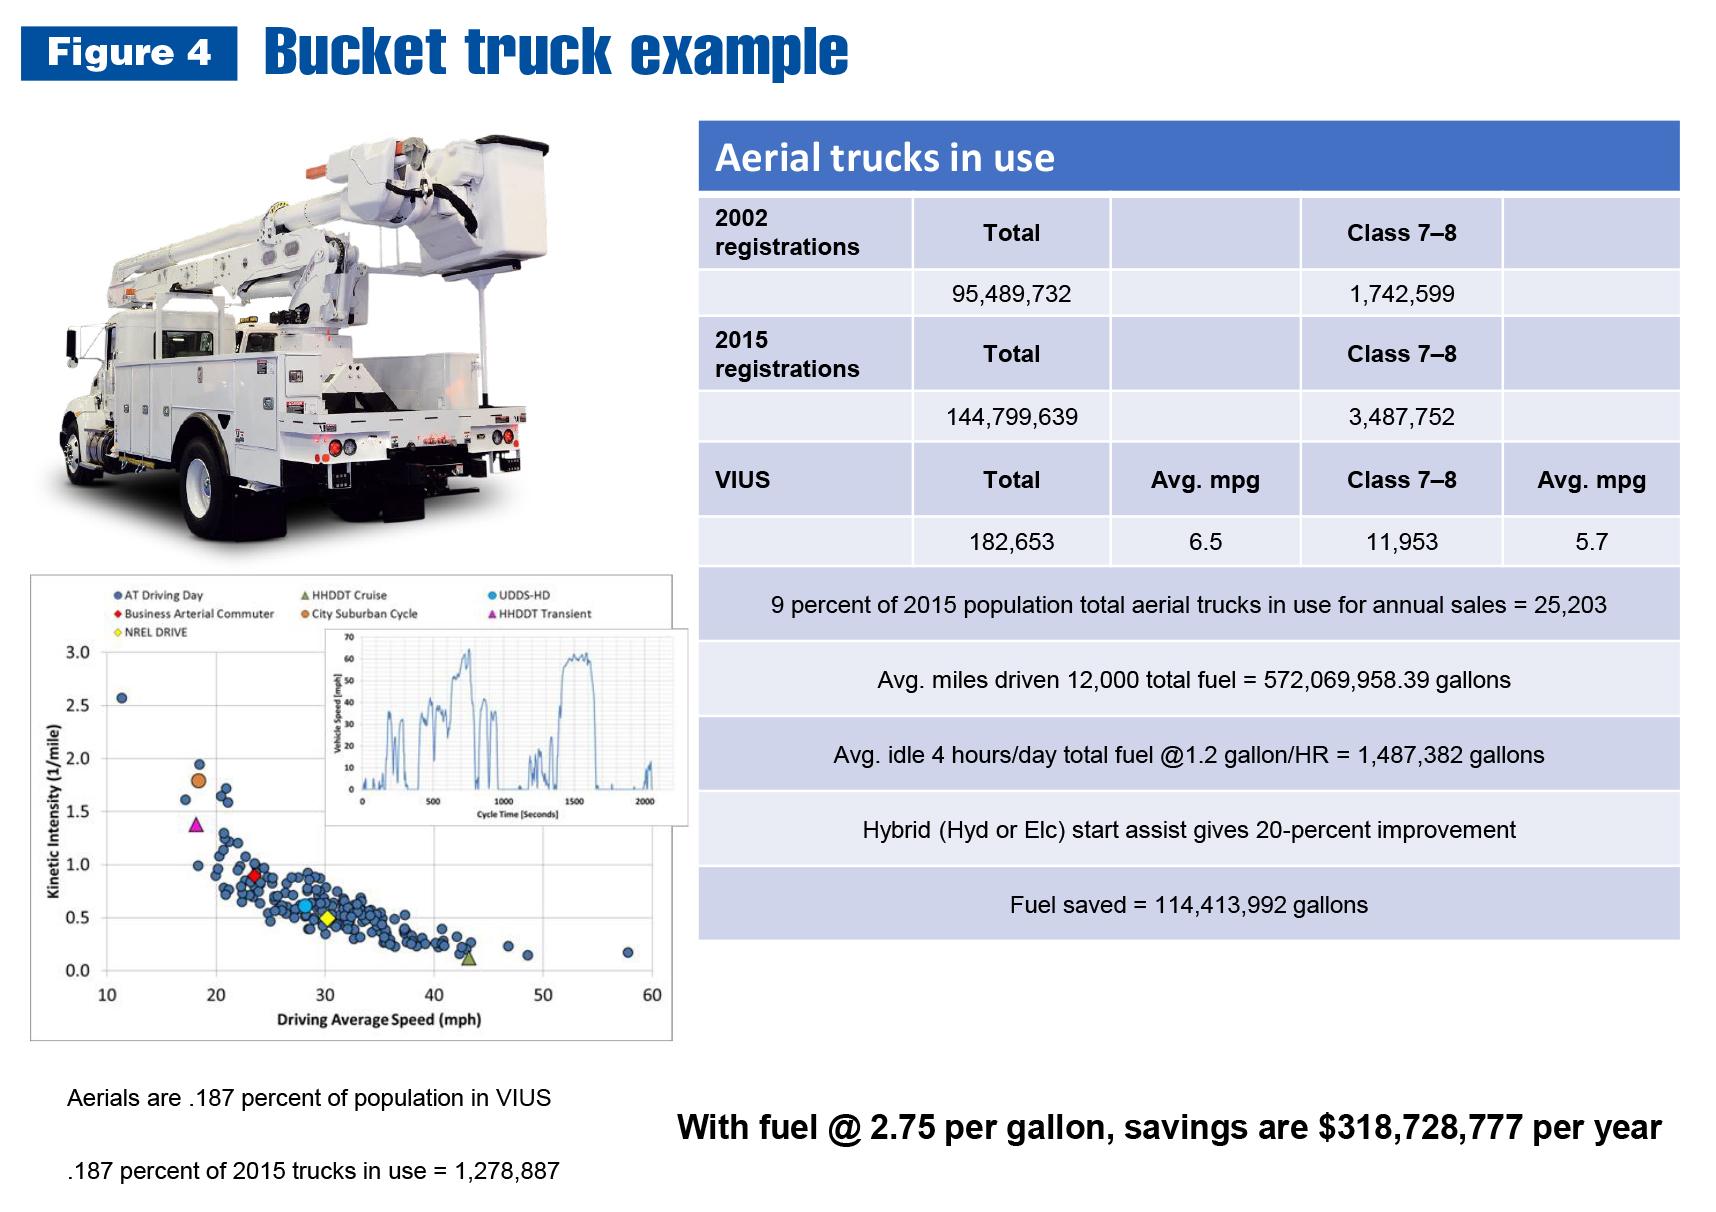
Our Executive Leadership Summit presentation included information developed in conjunction with National Renewable Energy Laboratory. Figure 4 estimates total in-use population of the bucket segment and shows annual fuel usage. U.S. Department of Energy is considering where it should dedicate research dollars at national labs to best impact fuel use in vocational trucks. This slide is one of several developed to show potential effects of technology deployments like engine-off operation at work sites.
This article addresses just a few of the industry trends and data shared during the 2017 Executive Leadership Summit. Visit ntea.com/executivesummit for a full recap.
For additional NTEA market data resources and reports, visit ntea.com/marketdata.