By Steve Latin-Kasper, NTEA Director of Market Data & Research
This article was published in the December 2016 edition of NTEA News.
At NTEA’s 2016 Executive Leadership Summit held in Las Vegas, Nevada, in October, forecasts were provided for the U.S. and global economies as well as the work truck industry. Commercial truck chassis sales are predicted to grow 2.2 percent in 2016 and 3.6 percent in 2017.
A forecast for the whole industry is essentially an average. In the work truck market, the 3.6 percent sales growth projection for 2017 will not be as accurate for some companies as compared to others.
NTEA’s forecast is segmented by class, and there are also estimates for tractors and commercial vans to provide guidance for specific industry segments. However, for any individual truck equipment distributor or manufacturer, a prediction for Class 3 sales, for example, isn’t detailed enough because businesses sell products to different application markets. Some snowplow companies target the landscaping industry, while others focus on state and local governments.
There are thousands of weight class/product/application market combinations — any one of which only a small number of NTEA members may regard as key to their corporate/marketing plans. Therefore, higher-level industry forecasts are just starting points.
In Figures 1–3, U.S. commercial electricity sales are compared to different industry weight class segments. The Class 2–3 subtotal had the highest correlation with electricity sales between 2004 and now. (The adjusted R-squared is .22, which means changes in the electricity series explain 22 percent of changes in the truck series.) As shown in Figure 1, the two data series usually trend in the same direction. Peaks and troughs in the truck series tend to lead turns in electricity sales.
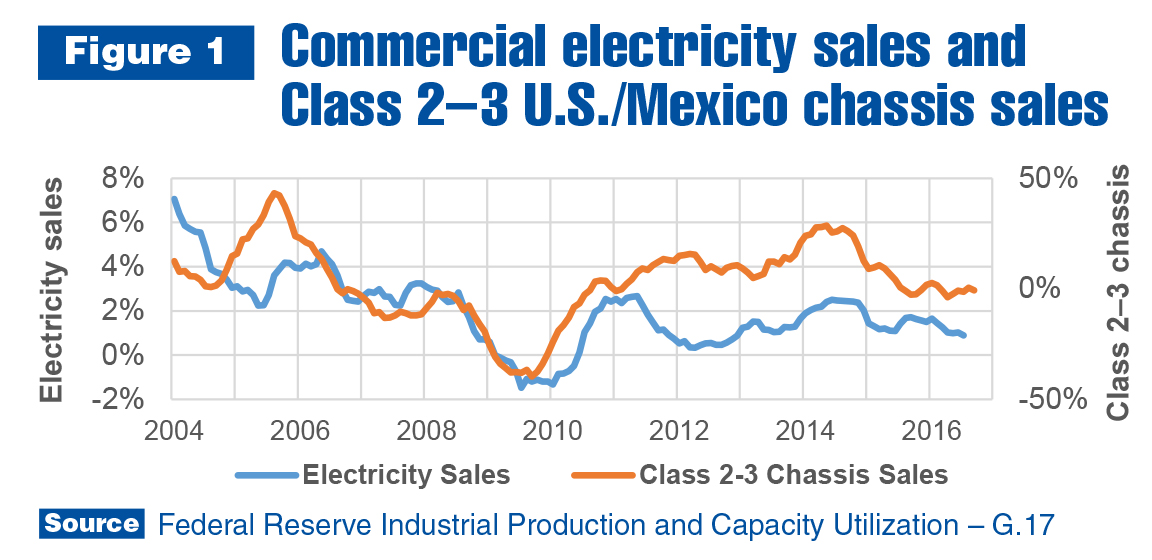
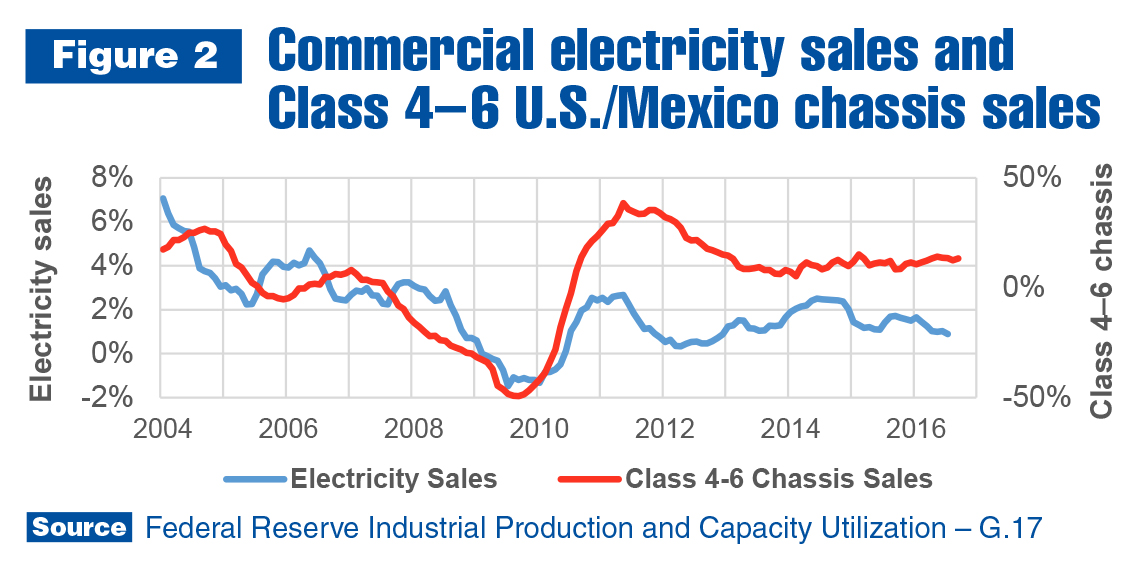
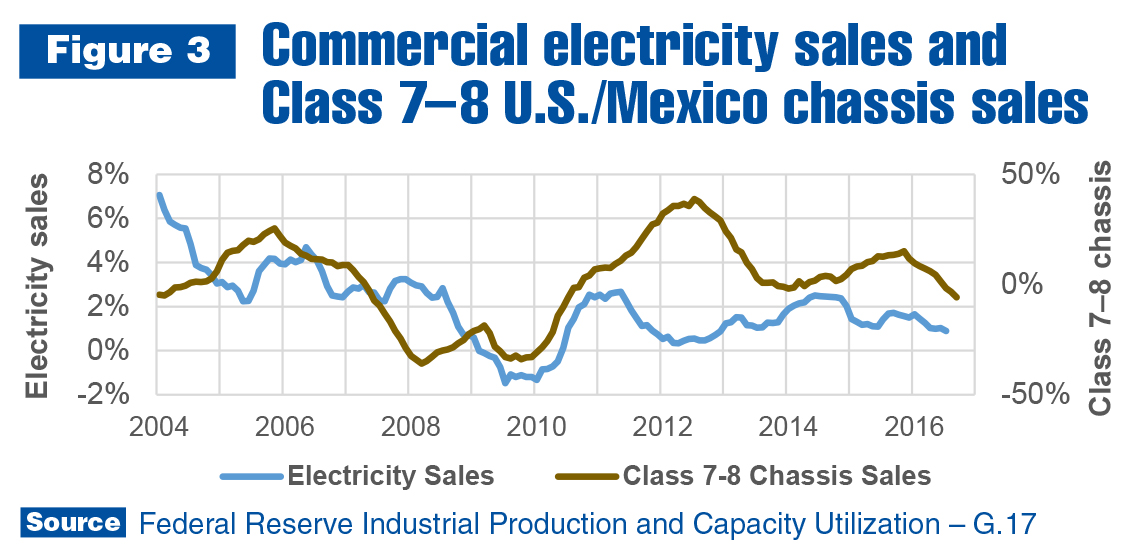
Figure 2 illustrates turns in the electricity sales cycle lead turns in Class 4–6. A deceleration of Class 4–6 sales growth from 2012–2013 was not matched by the electricity series, which helps explain why the adjusted R-squared between electricity and Class 4–6 sales was only .16. In comparison to Classes 2–3, the correlation difference isn’t of great concern, but the lead-time difference is critical. The electricity sales series indicates Class 4–6 sales growth could slow in the fourth quarter of 2016. For companies in this segment, knowing the difference between Class 2–3 and Class 4–6 relationships to the electric power industry matters to their forecasts.
Class 7–8 and electricity sales have an extremely low correlation. The adjusted R-squared is only .03. In other words, changes in the electricity series explain only 3 percent of shifts in Class 7–8. The slight correlation is mainly due to truck sales leading electricity sales between 2004 and the recession, and a reversal of that timing afterward. In fact, following the recession, electricity sales provided a longer lead time at turns in the cycle for Class 7–8 than for Class 4–6.
In sum, high-level forecasts are a necessary component of the market planning process, but they are not enough. Segmentation of relevant markets is critical, and data is available for most large application markets for trucks and truck equipment.
Learn more industry and market forecasts at ntea.com/marketdata or at Steve Latin-Kasper’s Work Truck Show 2017 session, Work Truck Industry Overview and Outlook.