By Steve Latin-Kasper, NTEA Director of Market Data & Research
This article was published in the December 2017 edition of NTEA News
Exports of commercial trucks and equipment rose in 2016. Total exports reached $16.17 billion — a slight 1.2 percent gain from $15.98 billion in 2015. Imports fell from a total value of $33.09 billion in 2015 to $31.95 billion in 2016 — a 3.4 percent decline.
Export growth will likely continue increasing through 2019 as the global economy starts to heat up again. International Monetary Fund (IMF) recently raised its forecast for global growth to 3.5 percent for 2017 and 3.6 percent for 2018. Emerging market economies are expected to grow faster, at a 4.6 percent rate in 2017 and 4.8 percent in 2018. As was the case for the past few years, Chinese and Indian economies are projected to keep growing faster than the global average, at a rate of 7 percent this year. In 2018, though, China’s growth rate is anticipated to decelerate to 6.4 percent, while India is expected to accelerate to 7.7 percent.
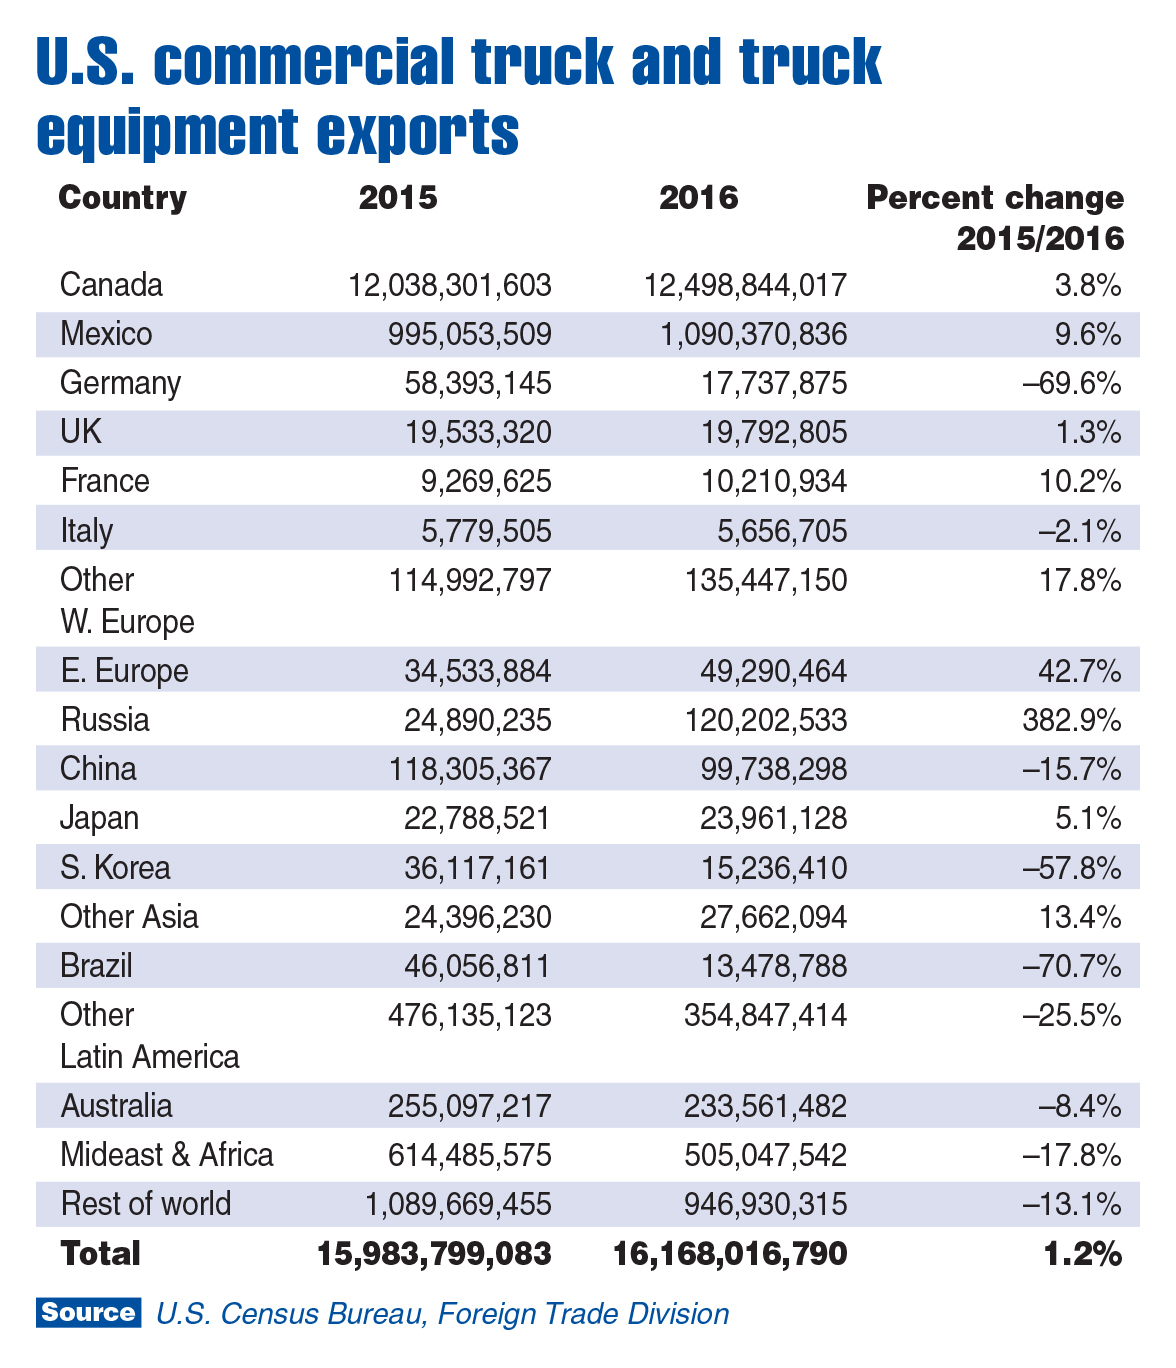
As shown in the chart above, Canada accounts for the majority of U.S. commercial truck and equipment exports, and Mexico is a distant second. Australia and Russia are the only other countries the industry exported more than $100 million worth of products to in 2016 —
although China was close. The Middle East/Africa is now a larger market for U.S. trucks and equipment than Latin America.
In 2016, U.S. exports of trucks and equipment grew much faster than average in a handful of markets, while falling in most others. Russia stands out, and serves as an example of why growth in other countries’ economies matters to U.S. producers. Last year, sales to Russia didn’t grow just because U.S. companies did a better job of selling. Russia is usually a good market for the nation’s trucks and equipment. Sales rose because the Russian economy grew.
Most of the rest of the world is expected to grow faster in 2018 than in 2017, which means U.S. exports will increase next year. Currency fluctuations may have an impact, but current forecasts indicate the value of the U.S. dollar will fall slightly relative to the European Union (EU) and Asia, and remain stable compared to much of the rest of the world. This is good news for exporters, but not for companies that import materials and/or products from EU and Asia.
The bulk of the exports referenced in the chart are OEM-related. The industry product with the highest amount of export sales ($8 billion) is Class 3 trucks. There were $2 billion worth of road tractors exported in 2016, mostly to Canada. The third most exported product was specialty purpose vehicles, with $1.2 billion of sales. In total, OEM products accounted for $15.71 billion of the $16.17 billion exports of trucks and equipment in 2016.
Equipment (snowplows, liftgates and truck bodies) accounted for the other $.46 billion. This number doesn’t include many other types of equipment (cranes, truck-mounted toolboxes, lighting products, tow hooks, truck refrigeration units, etc.) because they do not have specific export codes. It doesn’t mean they aren’t being exported — they are counted with other products in nonspecific codes.
It stands to reason, though, that if a large number of Class 3 pickups are exported, there should also be demand in the countries buying them, for products like pintle hooks, toolboxes, truck caps/covers, ladder racks, and others. The more important point is that as the global economy grows over the next couple of years, there will be more opportunities for U.S. work truck industry companies to diversify their customer base geographically.
A number of government agencies work with U.S. companies to help them get established in foreign markets. For more information on how to contact them, email me at stevelk@ntea.com.
For more industry market data, visit ntea.com/marketdata.