By Steve Latin-Kasper, NTEA Director of Market Data & Research
Meet our experts
This article was published in the June 2020 edition of NTEA News.
Key highlights
- Loss of retail sector jobs was more than twice as high in percentage terms as in the wholesale sector.
- Many commercial truck application markets are either operating near normal production levels or were less negatively affected by the recession than average.
- One issue caused by the pandemic — chassis availability — will be shared equally throughout the work truck industry for at least the next two quarters.
Clearly, the U.S. economy has been severely negatively affected by the ongoing pandemic — the extent of which varies substantially by economic sector and all the industries within each.
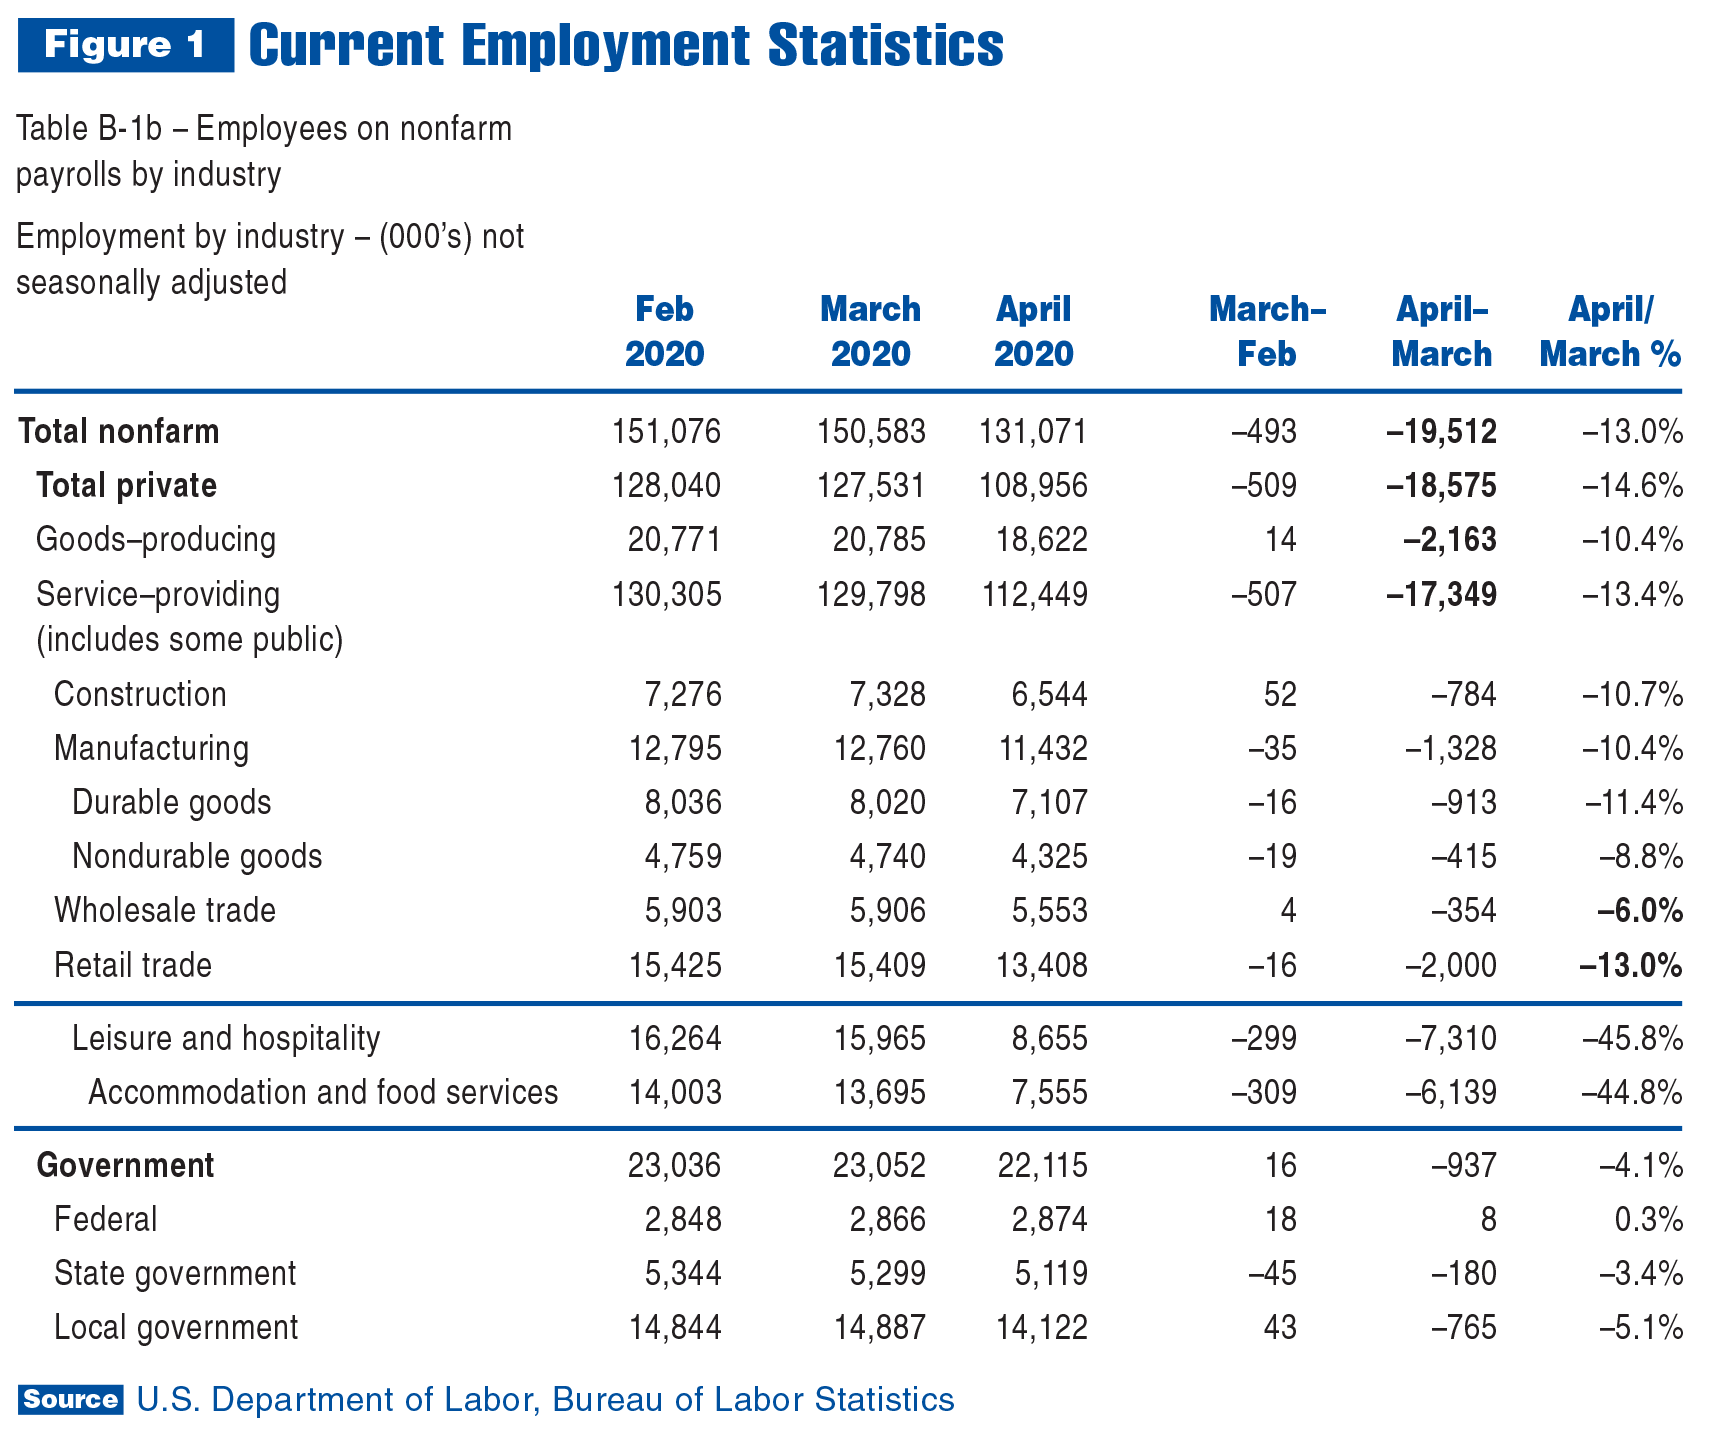
Discerning differences between industries can be accomplished by analyzing employment data. Department of Labor estimated a more than 20 million decline in U.S. employment. One way to unpack this number is to dig into more detailed datasets made available by Bureau of Labor Statistics. Figures 1 and 2 reflect data from Current Employment Statistics (CES), which tracks employment by industry, excluding farms.
As of February, 20.8 million people were employed in private-sector goods-producing industries, and 130.3 million in service provision industries. The 17.3 million jobs lost in that sector account for a majority of the total. In percentage terms, the 13.4% monthly decline from March in service sector employment wasn’t much worse than the 10.4% drop in the goods-producing sector. Further segmentation is needed to determine which industries bore the brunt of the impact.
The data makes it clear leisure and hospitality industries, within the larger services sector, accounted for a majority of jobs lost in April. They lost 7.3 million jobs for the month — nearly 50% of their total employment, which is well above the services sector average. This matters to the work truck industry, since restaurants and bars have many goods delivered by truck. When they are not taking deliveries, trucks are sitting idle, and fleets with idle vehicles don’t order new ones.
Another example of unequal economic impact is demonstrated by comparing wholesale and retail employment. Loss of retail sector jobs was more than twice as high in percentage terms as in the wholesale sector. This disparity exists because people who lost jobs throughout the services sector are more closely connected to the retail sector as consumers than they are to the wholesale sector.
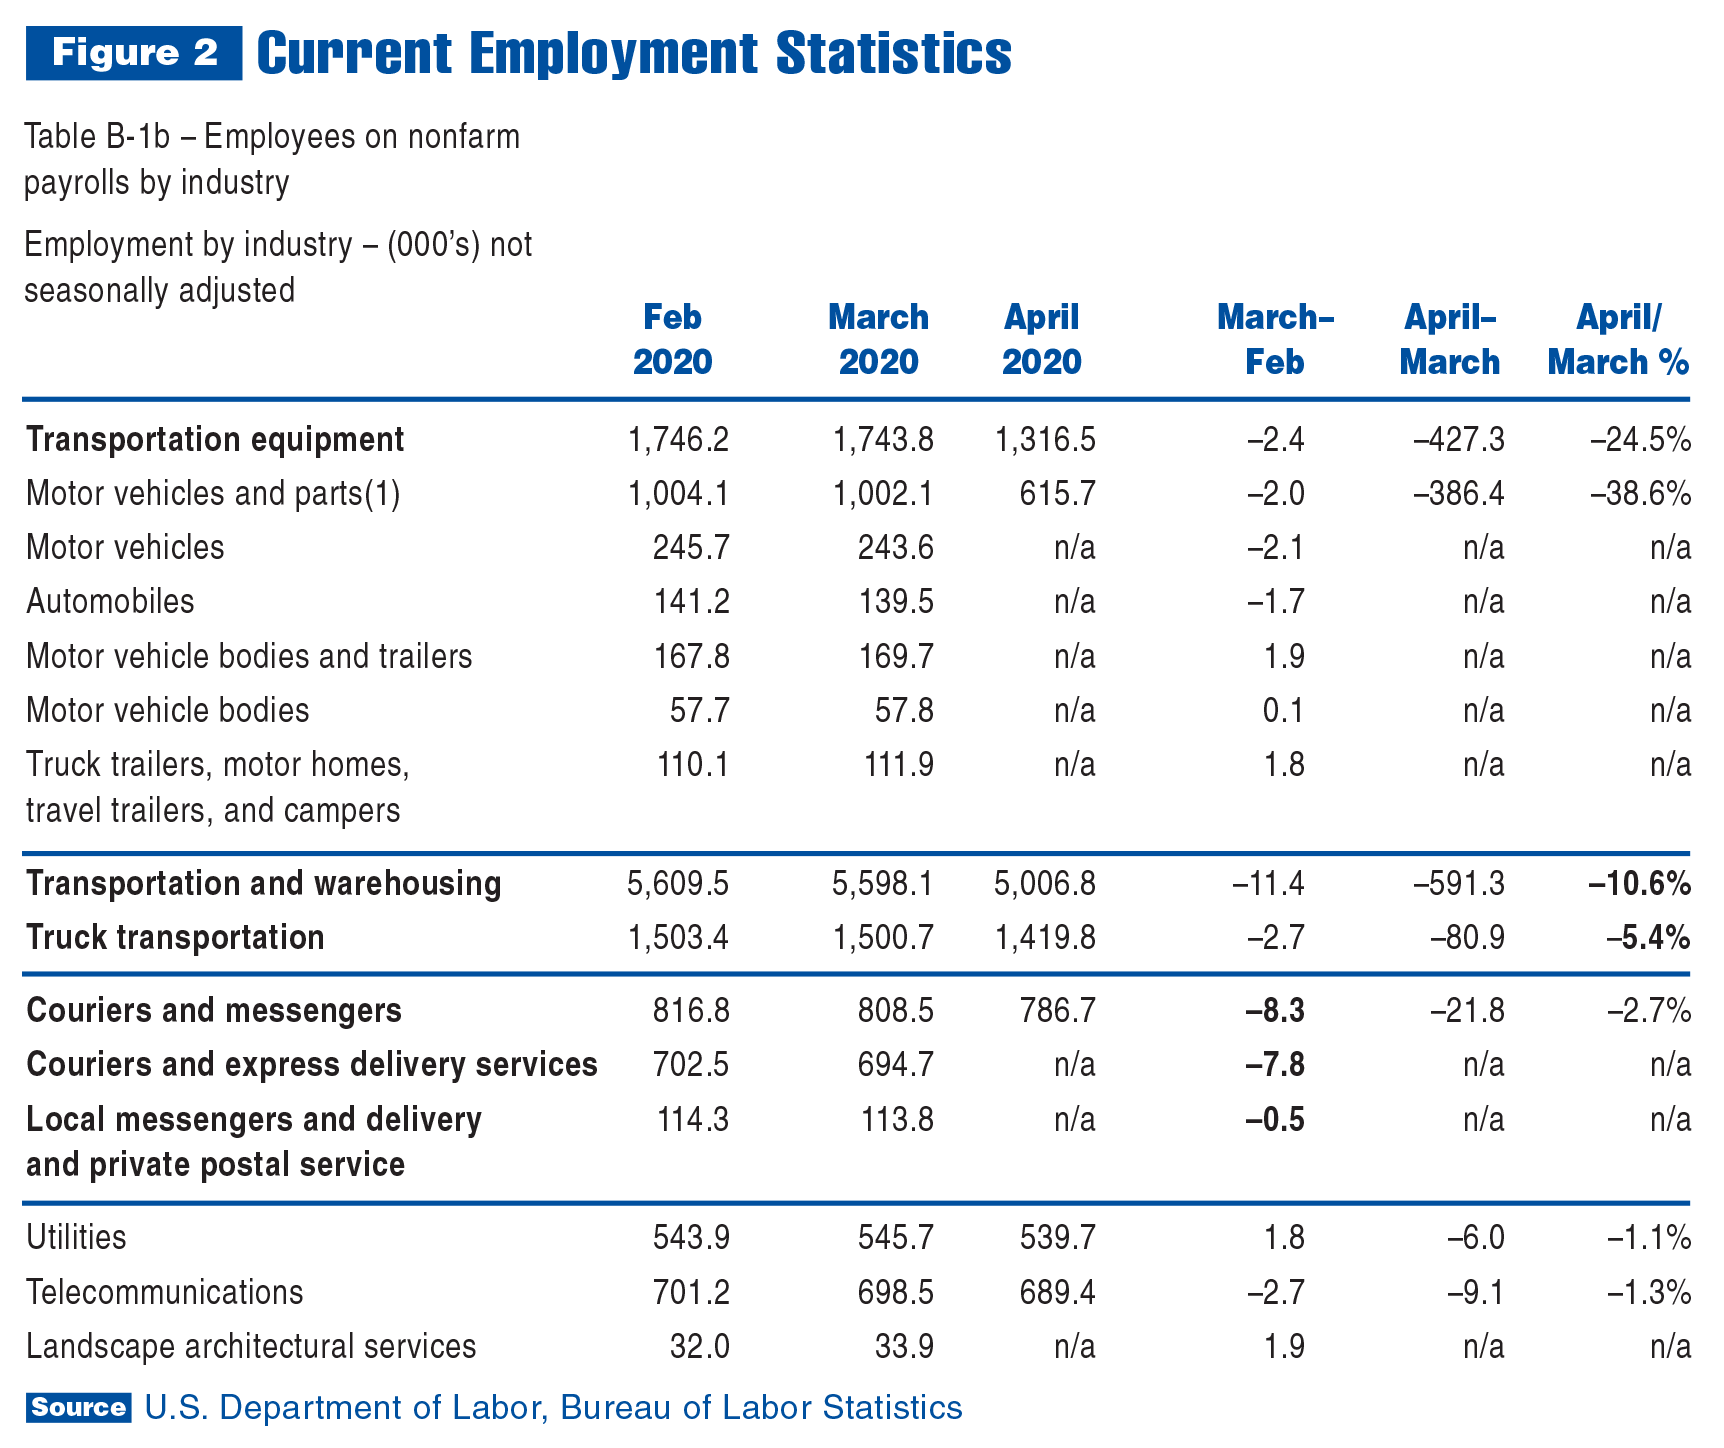
The connection to consumers who are no longer consuming appeared in motor vehicle industry data, as well. Figure 2 shows the total loss of transportation equipment industry jobs was 2.5 times higher than for the manufacturing sector. This is because passenger vehicle demand fell sharply when jobs were lost. However, this logic does not apply to commercial trucks.
Data in Figure 2 makes it clear trucks are essential. At time of publication, industry-level data wasn’t available for April, but March data shows when motor vehicle OEMs started laying off their workforce, motor vehicle body and trailer manufacturers were still hiring. In the transportation and warehousing industry group, truck transportation employment fell only about half as much as the total for the rest of the group.
In other commercial truck application markets, numbers were also better than average. Utility and telecommunications industry employment fell slightly more than 1% in April. Energy that wasn’t being used at work was being utilized at home. Calls that weren’t being made at work were taking place at home.
Landscapers were still hiring in March. They work outside, so there wasn’t as much concern about infection, and contracts weren’t cancelled. Opposite logic was applied to the residential segment of the construction industry, and many contracts for work done inside homes were cancelled.
Last but not least, in the courier and messenger industry, employment fell 8.3% in April. For local courier companies, though, it barely budged, and according to anecdotal evidence, all of the companies competing in the last-mile delivery market are hiring. In May, it’s likely many who lost jobs in other industries will move to industries that are hiring.
In sum, due to their essential nature or connectivity to markets that are growing because of the pandemic, many commercial truck application markets are either operating near normal production levels or were less negatively affected by the recession than average. In total, commercial truck sales are falling. The current forecast calls for a 25–30% decline in Class 3–7 commercial truck registrations this year, but that is an average. Some industry segments will do better, and some worse. Class 8 sales (including tractors) are expected to decrease more than 30%.
One issue caused by the pandemic — chassis availability — will be shared equally throughout the work truck industry for at least the next two quarters. According to NTEA’s OEM Monthly Statistics Program, roughly 108,000 Class 2–8 chassis were shipped to North American dealers/pools in the first quarter, and about 94,000 units were sold. There wasn’t much carryover from 2019, which means chassis inventory was extremely low at the end of March.
Anecdotal evidence from around the industry indicates enough chassis were already being upfitted to get most upfitters through May. Since OEMs will not return to normal production levels until sometime in June (if there are no supply chain bottlenecks), chassis availability could be an issue, and due to pent-up demand, lead times may be extremely stretched.
At some point, likely in the third quarter, economic growth will resume. Note, for planning purposes, truck application markets least negatively affected by the recession will likely provide the best growth opportunities as the economy recovers in the second half of this year. A number of these markets were mentioned in this article, but much more industry detail is available. To access complete CES data, visit bls.gov/ces, click Employment and Earnings Tables under the CES Data dropdown, and select table B-1b.
For more COVID-19 resources and updates, visit ntea.com/covid-19.