By Steve Latin-Kasper, NTEA director of market data & research
This article was published in the October 2019 edition of NTEA News.
Key highlights
- Class 2–7 sales should continue growing (at a decelerating rate) through the first half of next year.
- There is reason to estimate the next U.S. recession may be about one year away.
- Federal government spending isn’t expected to slow this year or in 2020 until after the election.

Economy
U.S./Mexico commercial truck chassis sales fell 3.2% in June 2019 as compared to June 2018. The decline resulted from strip and conventional chassis segment downturns outweighing cutaway and low cab-over-engine gains — pulling cumulative growth down to 5.2%. In Canada, sales jumped 8.8% for the month as compared to June 2018 due to large increases in cutaway and conventional segments overshadowing big decreases in strip and low-cab-over-engine markets — bringing up the cumulative rate to 3%.
The U.S. economy continued growing in the second quarter but at a decelerating rate. Per the second estimate released by Bureau of Economic Analysis (BEA), real gross domestic product (GDP) increased at an annual 2% rate in the second quarter of 2019. In the first quarter, real GDP rose 3.1%. (BEA’s advance estimate called for a 2.1% GDP jump.)
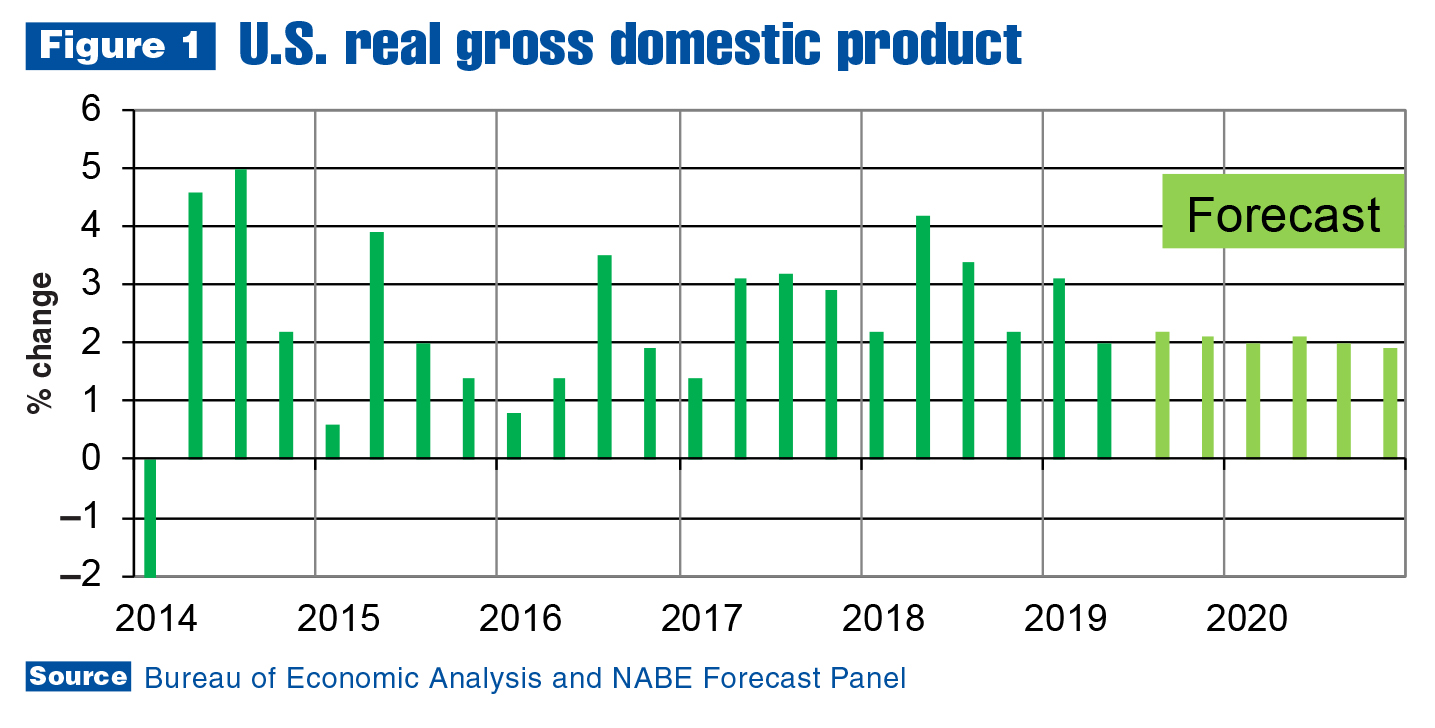
Second-quarter real GDP growth reflected positive contributions from personal consumption expenditures (PCE), federal government spending, and state and local government spending — which were partly offset by negative contributions from private inventory investment, exports, and residential and nonresidential fixed investment. The deceleration in real GDP growth primarily reflected downturns in inventory investment, exports and nonresidential fixed investment, which were partially offset by accelerations in PCE and federal government spending.
In sum, the latest GDP report indicates consumers are the main reason for continued U.S. economic growth, with some help from government, which will likely remain the case for state and local governments going forward (good news for the work truck industry). Federal government spending isn’t expected to slow this year or in 2020 until after the election. Current deficits are larger than expected, and fiscal policy may change substantially post-election.
Entering the fourth quarter of 2019, most U.S. economic sectors are doing well, except agriculture and construction. Farm incomes fell before the trade war with China, exacerbating existing challenges. The construction sector is experiencing a labor shortage, and home prices are rising significantly faster than incomes. Demand is high, but will remain pent up until incomes balance with prices.
The rest of the economy would be seeing more robust growth, but tariffs negatively
impacted supply chains around the globe — adding to political uncertainty surrounding
the U.S. national election. As was the case in 2016, business owners will probably be cautious regarding capital expenditures in 2020.
Work truck industry
U.S./Mexico commercial truck chassis sales rose 8% in the second quarter of 2019 as compared to the second quarter of 2018. Cutaways had the fastest acceleration, as sales fell at an 11.1% rate in the first quarter and rose 27.6% in the second. Conventional chassis sales surged to 8.1% after registering 6.6% growth in the first quarter. Low-cab-over-engine increased to 7.7% after growing 1.1% in the first quarter.
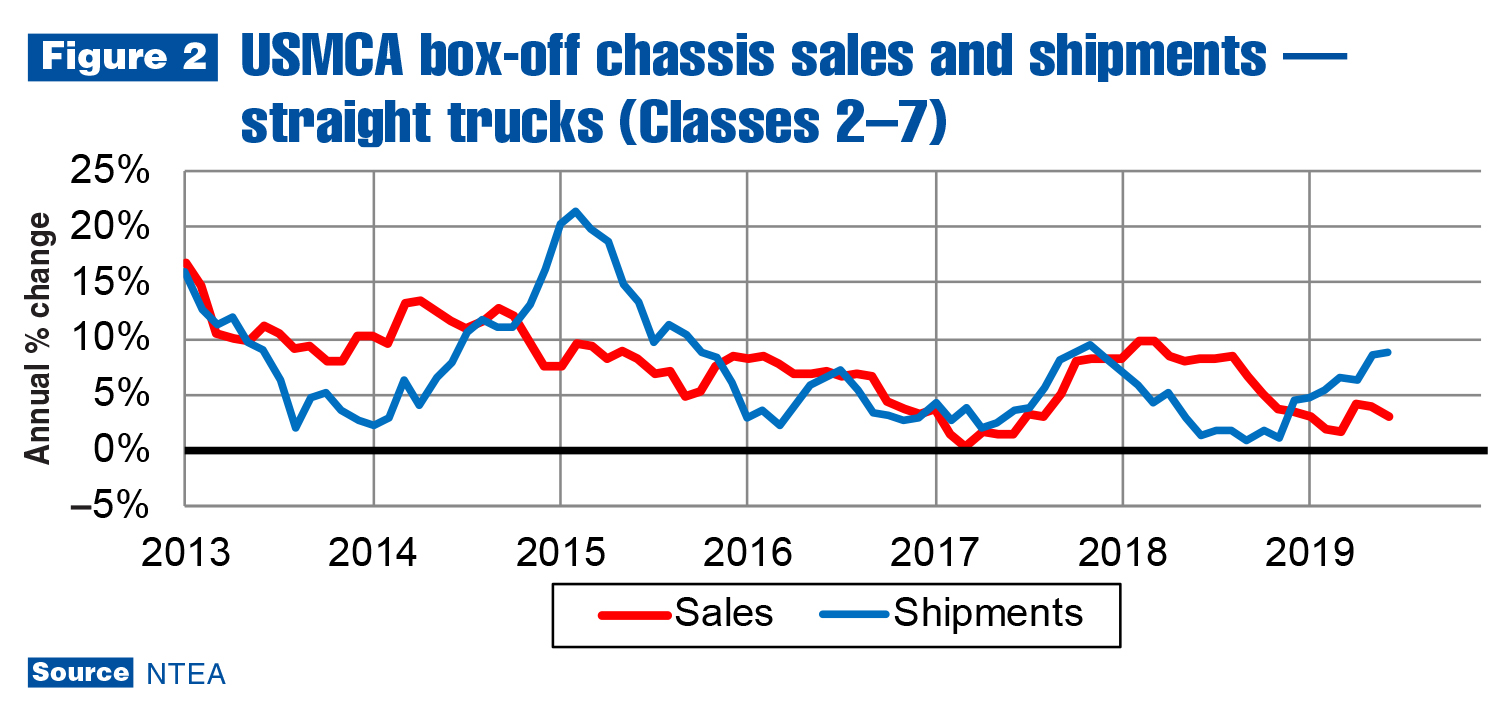
The strip chassis segment bucked the trend — after rising 3.3% in the first quarter, sales fell 16.3% in the second. Weight classes most impacted by the fall in strip chassis sales were Classes 3 and 7. Class 3 sales dropped for the second consecutive quarter, and Class 7 decelerated from a 16.2% growth rate in the first quarter to 3.2% in the second. Class 2 and 6 sales both increased at double-digit rates for the second consecutive quarter, but the rate of growth decelerated in
Class 2 and accelerated in Class 6. In Classes 5 and 8, the growth rate accelerated slightly from the first quarter to the second.
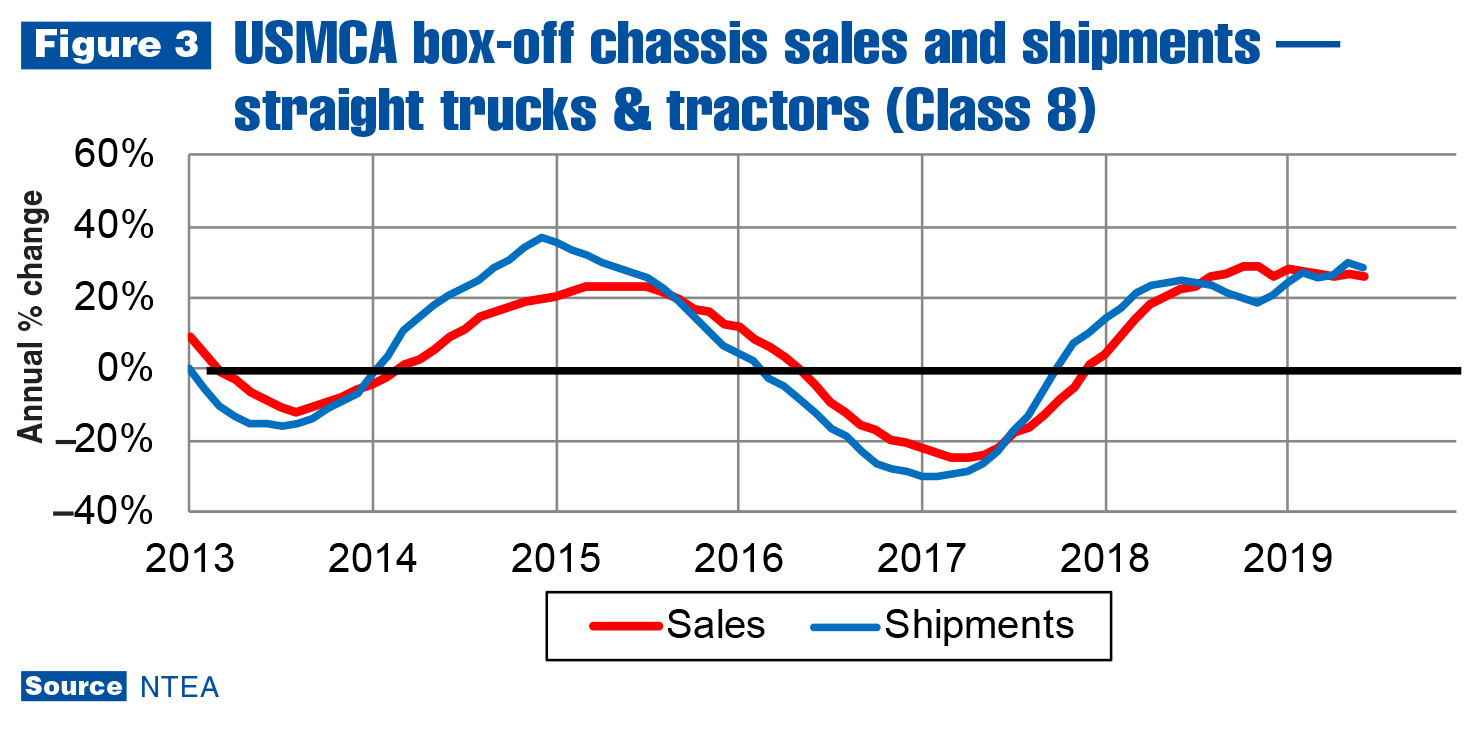
Tractor sales slowed from 31.2% growth in the first quarter to 21.7% in the second. Continued deceleration is expected through the second half of this year, followed by a decline in 2020. Commercial van (Class 1–3) sales decelerated from 12.6% in the first quarter to 7.4% in the second. A large gain in April outweighed consecutive monthly declines in May and June.
In Canada, chassis sales dropped from 3.6% in the first quarter to 2.5% in the second. Sales in the conventional cab segment — the largest in terms of units — rose at a 9.7% rate.
In Canada, chassis sales dropped from 3.6% in the first quarter to 2.5% in the second. Sales in the conventional cab segment — the largest in terms of units — rose at a 9.7% rate in the second quarter, outweighing large declines in strip and low-cab-over-engine. Sales fell in Classes 2–3 and 5–6, but were outweighed by large gains in Classes 4 and 7–8. Tractor sales declined from 26.4% in the first quarter to 14.3% in the second. Commercial van sales fell 0.7% in the first quarter and 6.4% in the second.
Metals and energy prices
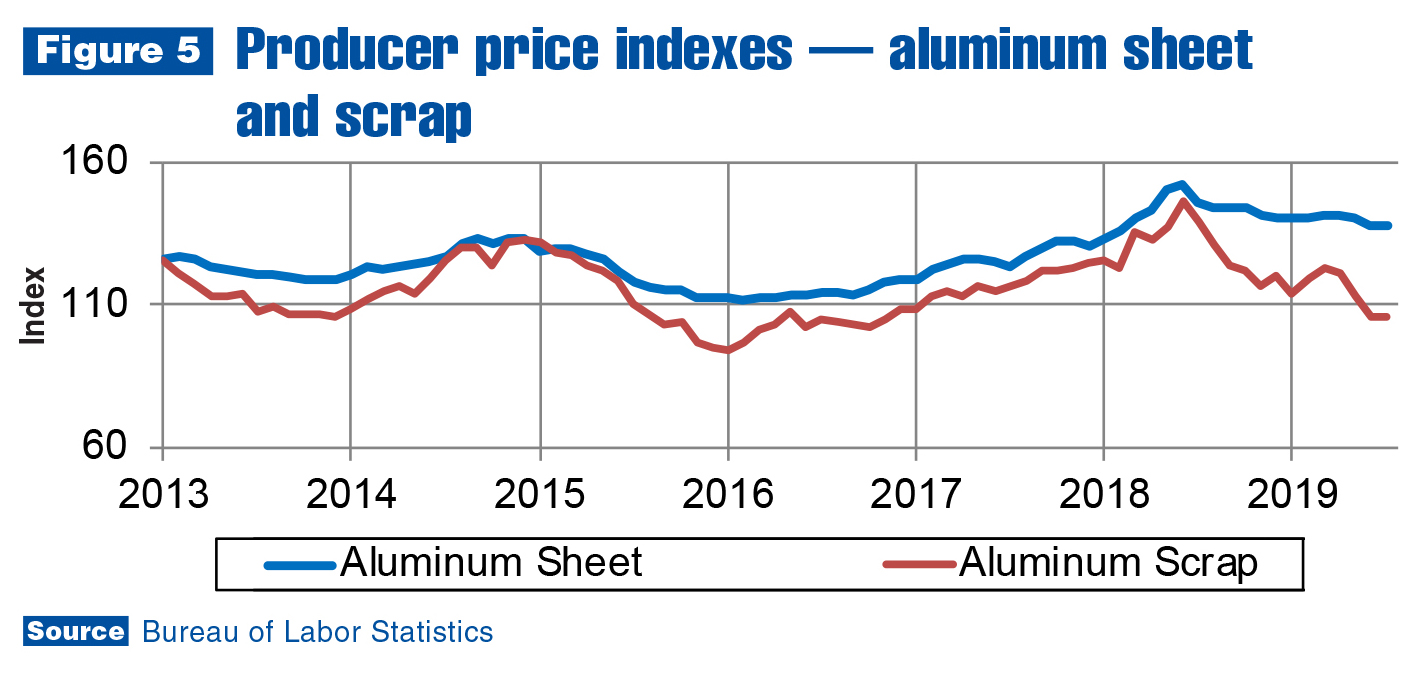
Tariffs on Canadian and Mexican steel and aluminum were lifted in May 2019 but remained in other countries. However, since most U.S. steel and aluminum imports are from Canada and Mexico, downward pressure on U.S. steel and aluminum prices was immediate, and they continued falling.
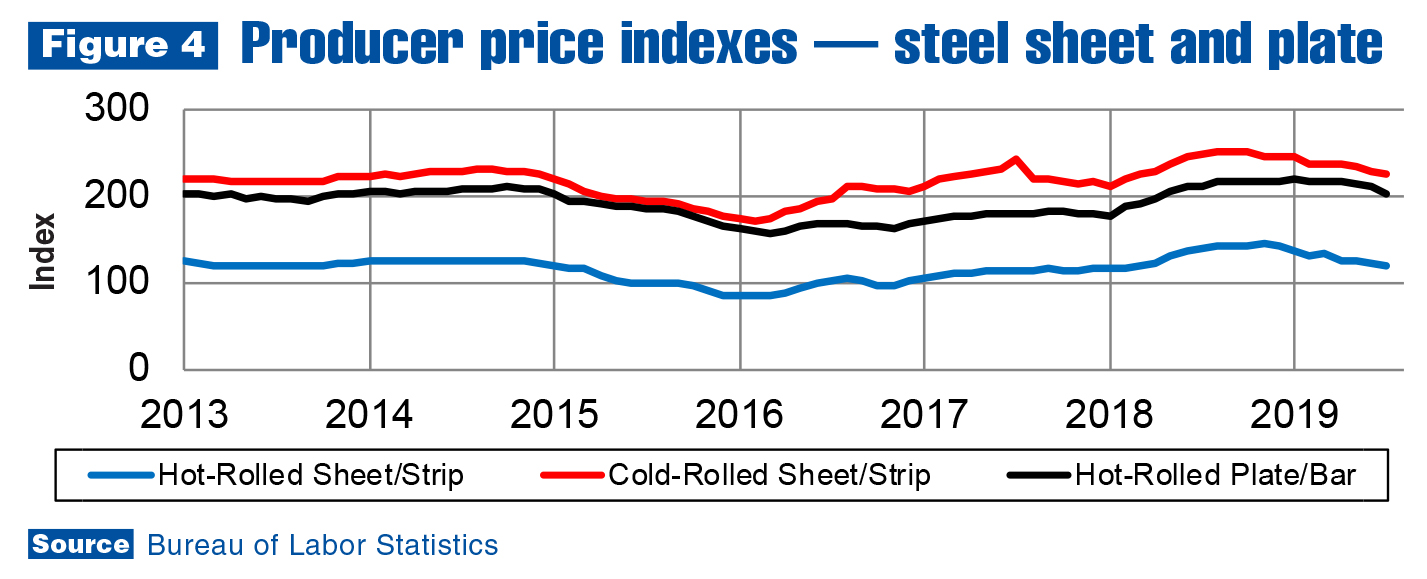
As of July, aluminum sheet prices were down 2.3% for the most recent quarter, and 5.3% for the year. Sheet prices will likely continue falling since scrap prices have dropped even further. In the most recent quarter, aluminum scrap prices were down 12.4% (23.8% for the year). In the steel sheet/strip market, hot-rolled prices decreased 4.2% in the most recent quarter, and 13.9% for the year through July. Cold-rolled prices fell 4.6% in the most recent quarter and 8.9% for the year. Prices of hot-rolled plates/bars/shapes declined 5.9% in the most recent quarter, and 3.9% for the year.
Economic factors influencing the market include high inventories in India’s steel industry; an affirmative ruling by U.S. Department of Commerce regarding dumping of fabricated structural steel by China and Mexico; and the Ahval company in Turkey halting steel production. All of these factors will likely be outweighed by ongoing massive overcapacity in China’s steel industry and slowing global economic demand.
In the oil market, the Brent spot price was relatively stable in July and August at about $62 per barrel. U.S. economic sanctions on Iran did not lead to higher prices as expected when announced, but other factors had a greater impact. Higher U.S. production and government storage levels put downward pressure on the global price, which was compounded by a decelerating global economy. The June National Association for Business Economics (NABE) Outlook predicts the Brent spot price will be $60 at the end of 2019.
Leading indicators
In July, housing starts rose 1.6% as the second consecutive same-month-previous-year increase after declines from January through May while the cumulative rate improved to –3.1%. Housing prices continued rising in most U.S. urban areas; however, they’re no longer increasing as quickly — making housing more affordable and resulting in a more positive 2020 housing starts forecast. According to NABE’s June Outlook, housing starts are predicted to reach 1.25 million units this year, and 1.28 million in 2020. Incomes will likely continue growing while price increases keep decelerating.
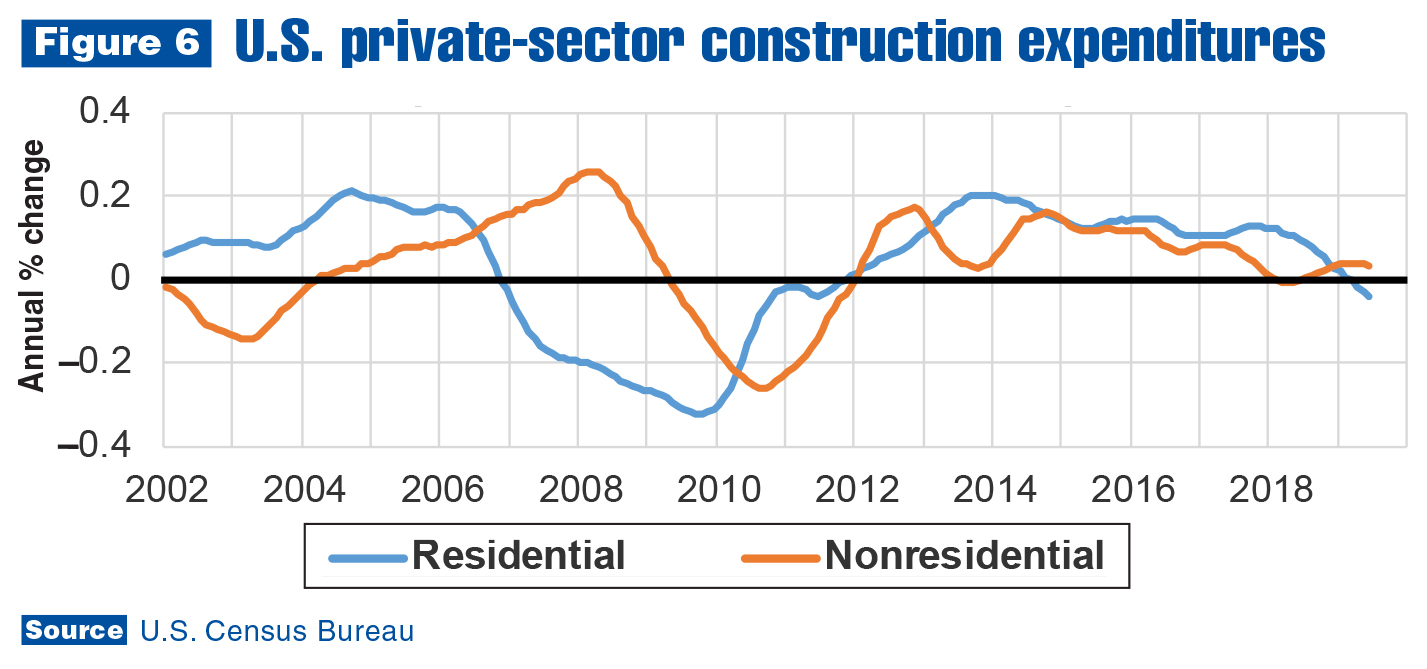
As shown in Figure 6, total expenditures on residential housing have fallen on an annual percent change basis since the first quarter. Nonresidential construction expenditures peaked and should start trending down, which is worrisome. Expectations were still positive as of June, but nonresidential expenditures tend to follow residential, and if data over the next couple months shows nonresidential is trending down, expectations for 2020 will likely change.
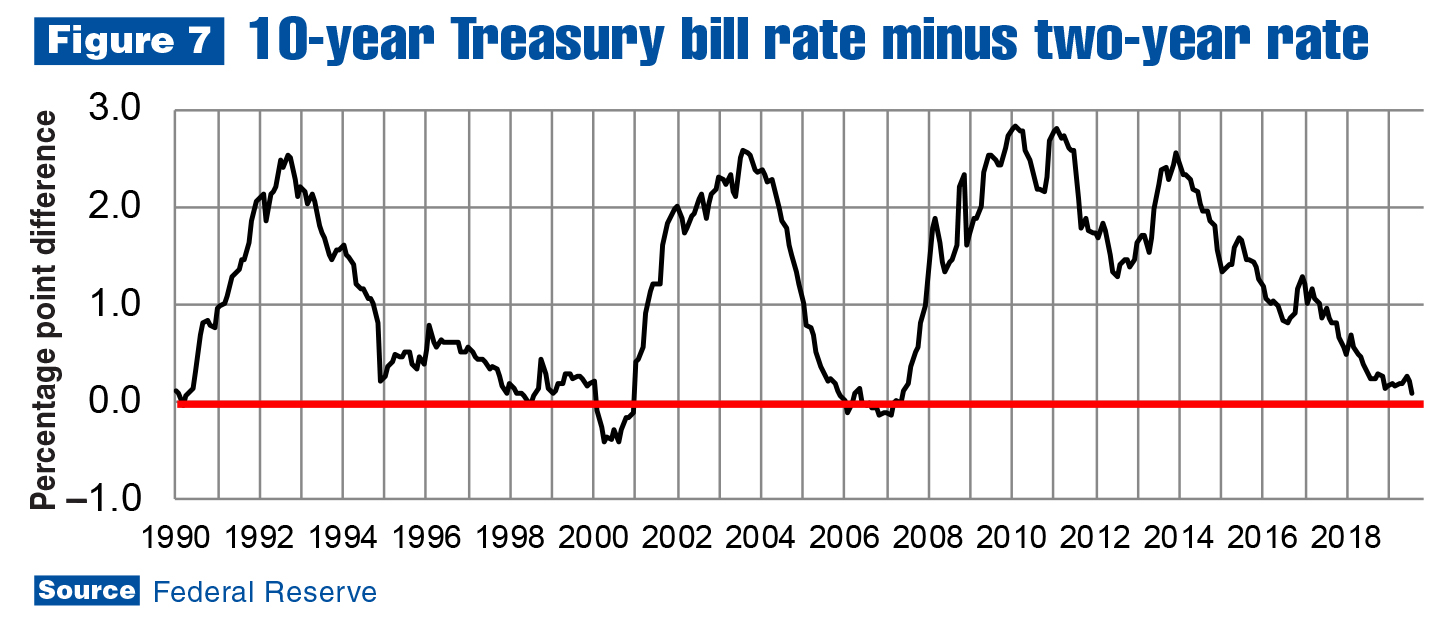
Construction sector growth is clearly decelerating, but doesn’t necessarily mean the next recession is around the corner. The yield curve (shown in Figure 7), though, may invert soon. A yield curve inversion is one of the best indicators of an impending recession, and the two-year Treasury bill interest rate rising higher than the 10-year rate merited headlines in August.
In fact, the two-year rate was higher than the 10-year rate for three days from Aug. 27–29. They were equal for the next couple of days, and as of Sept. 4, the 10-year rate was higher again, but not by much. Figure 7 illustrates monthly averages, and the graph clarifies rates have not yet inverted on that basis. However, every yield curve inversion starts on a given day, and with two- and 10-year rates essentially equal, there is good reason to estimate the next U.S. recession is likely about one year away.
The yield curve will probably invert again in the near-term as the economy continues to decelerate. If this occurs, timing and length of the next recession will become clearer. For now, it’s unlikely a recession will start before the third quarter of 2020. In relation to the work truck industry, Class 2–7 sales should continue growing through the first half of next year — albeit, at a decelerating rate. For Class 8, the next recession may start in the first quarter of 2020.
Industry resources