By Steve Latin-Kasper, NTEA Director of Market Data & Research
This article was published in the April 2019 edition of NTEA News.
Key highlights
- U.S./Mexico commercial truck chassis sales are predicted to grow about 2 percent this year.
- The U.S. economy will likely continue growing (at a decelerating rate) in 2019, but is expected to enter a recession by 2021.
- National Association of Home Builders forecasts less than 1 percent growth in housing starts for 2019.

U.S. economy
U.S./Mexico commercial truck chassis sales growth decelerated to 2.1 percent in the fourth quarter of 2018, as compared to the fourth quarter of 2017 — pulling the annual growth rate down to 4.0 percent. In Canada, sales increased 14.0 percent in the fourth quarter — a decline from 18.4 percent growth in the third quarter, but high enough to push the annual growth rate up to 8.0 percent.
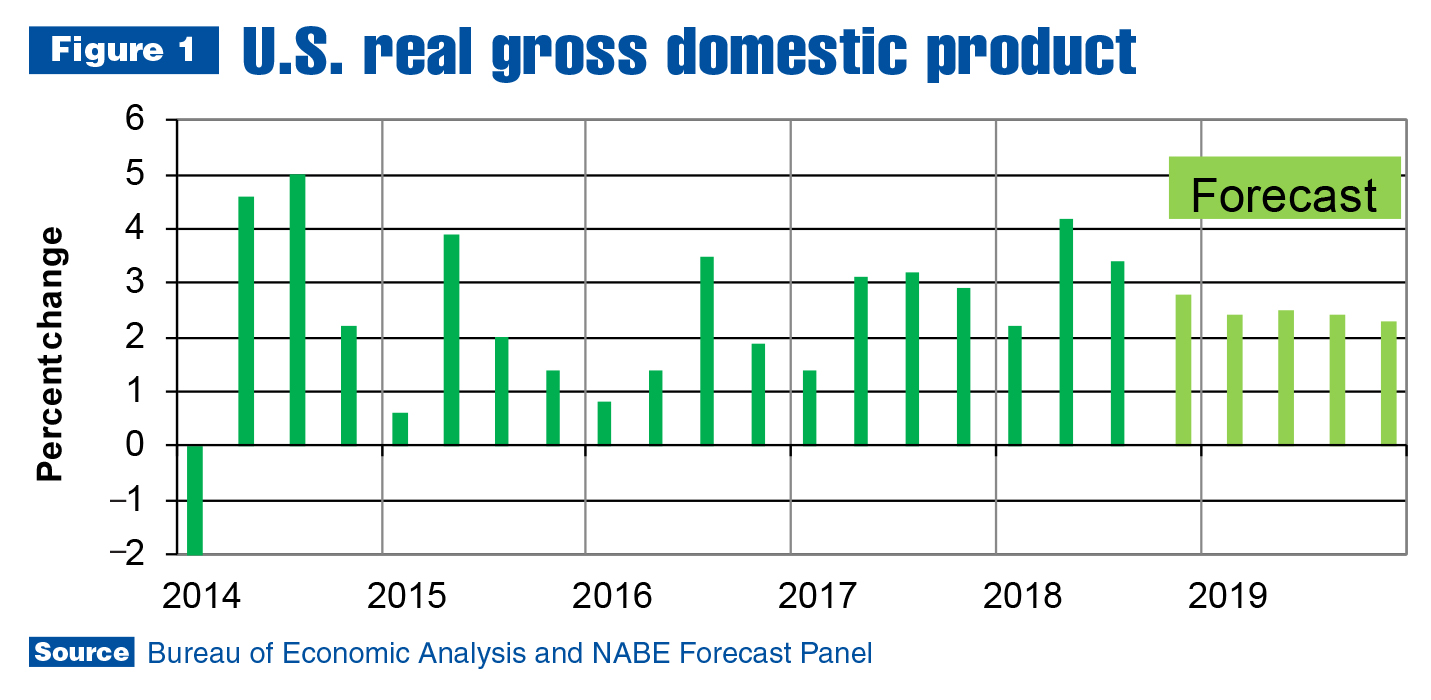
At the end of February, Bureau of Economic Analysis (BEA) announced U.S. gross domestic product (GDP) rose 2.6 percent in the fourth quarter. This was a 0.8 percentage point decline from 3.4 percent growth in the third quarter, which was a 0.8 percentage point decrease from 4.2 percent growth in the second.
Both Bloomberg and National Association for Business Economics (NABE) forecast panels are calling for continued deceleration in economic growth in 2019. End-of-year predictions are for 2.2 percent U.S. economic growth, but expectations were ramped down as the federal government shut down for over a month. First-quarter growth is now expected to be about 1.5 percent.
The core issue driving forecasts for slower growth in 2019 (and again in 2020) is the tight labor market. There is an upper limit to how much production can be attained from any laborer. Overtime is a partial solution but won’t solve the problem, which can be described as a generational imbalance.
The youngest baby boomers were born in 1964. If they wait until age 67 to retire, baby boomers won’t completely exit the workforce until 2031. The youngest millennials were born in 1996. Assuming this generation is fully in the workforce when the youngest turns 25, they’ll all be employed by 2021. There is some wiggle room regarding both dates. For example, baby boomers could wait until they’re 70 to retire.
Regardless, there will be a five- to 10-year period between full employment of millennials and full retirement of baby boomers. Since the average annual number of baby boomer retirees between now and approximately 2031 will be 3.6 million, this could be an issue. There have been enough millennials to replace the retiring baby boomers up to now, but from roughly 2025–2030, there won’t be any more millennials to replace baby boomers. Businesses will start hiring post-millennials (known as Generation Z), but there are not enough of them to replace the last five years or so of baby boomer retirees. Bottom line, the labor market will likely get even tighter in the second half of the 2020s. This will require planning to manage what could be a substantial labor shortage — but fortunately, there is still time to prepare.
In the here and now, unemployment remains below 4 percent, and some economists predict the rate will fall to 3.5 percent by the end of 2019. Basically, all working-age adults who want to be employed will be. This means consumer expenditures will continue increasing, which will fuel U.S. economic growth this year.
Not all industries will progress at the same rate, though. There will likely be large differences between durable and nondurable goods growth rates, which is what occurs toward the end of most economic expansions. Once you’ve bought the durable good (auto, appliance, power tool), you don’t need to buy another for years. When the rate of durable goods growth slows, the economy’s growth rate generally follows suit.
In sum, the U.S. economy is expected to continue growing in 2019, but at a decelerating rate. The roughly 3.0 percent growth in 2018 is anticipated to fall to about 2.5 percent. NABE’s most recent forecast indicates the U.S. economy will enter recession by 2021.
Work truck industry
As shown in Figure 2, Class 2–7 shipments and sales increased in 2018. Shipments growth decelerated more swiftly than sales throughout the year until December, when shipments were almost 10,000 units greater than in December 2017. Sales also rose in December, but not as much. Relative to shipments, sales were about 4,000 units higher in December 2018.
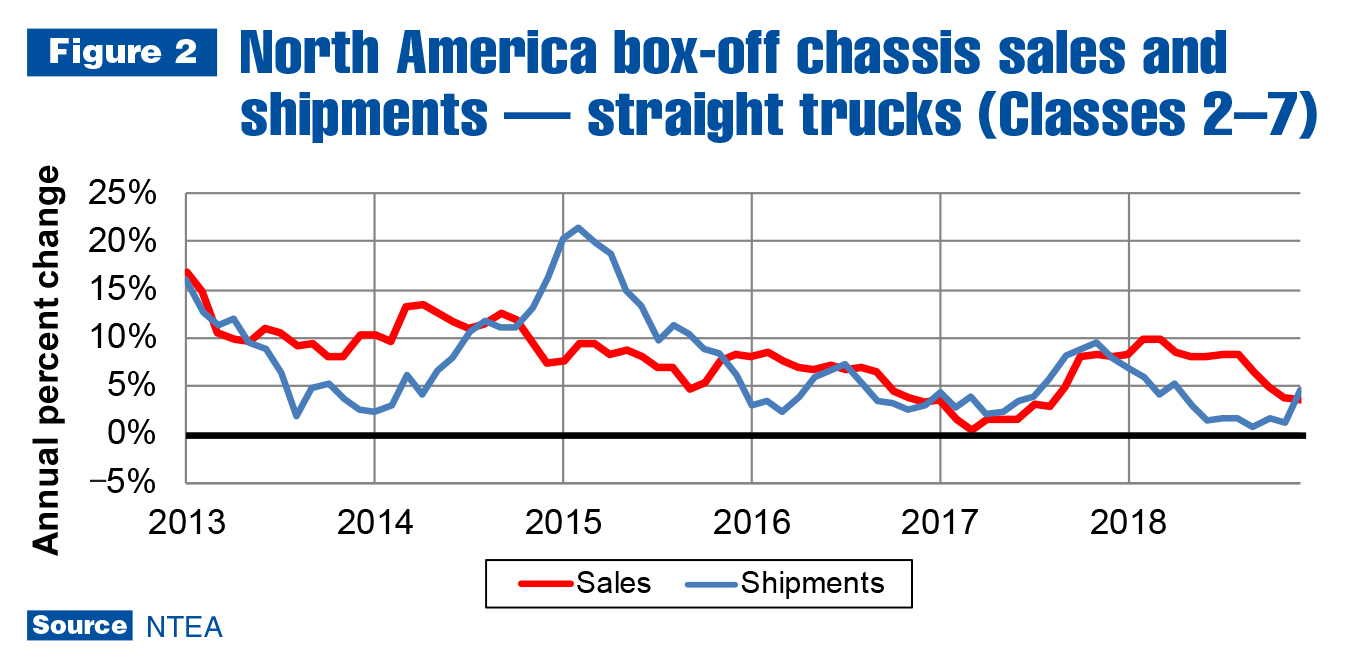
This was different from the last two years — sales were almost 14,000 units higher than shipments in December 2017 and 9,000 units above at the end of 2016. To be clear, there was still a December effect (sales higher than shipments during that month) in 2018, but a mild version relative to the last two years, when it contributed greatly to extended lead-times. This means shipments will probably outpace sales in the first half of 2019 — more than enough to make up for the 4,000-unit difference registered in December 2018 — which will likely result in an improvement in chassis availability. As always, there will be differences between weight classes.
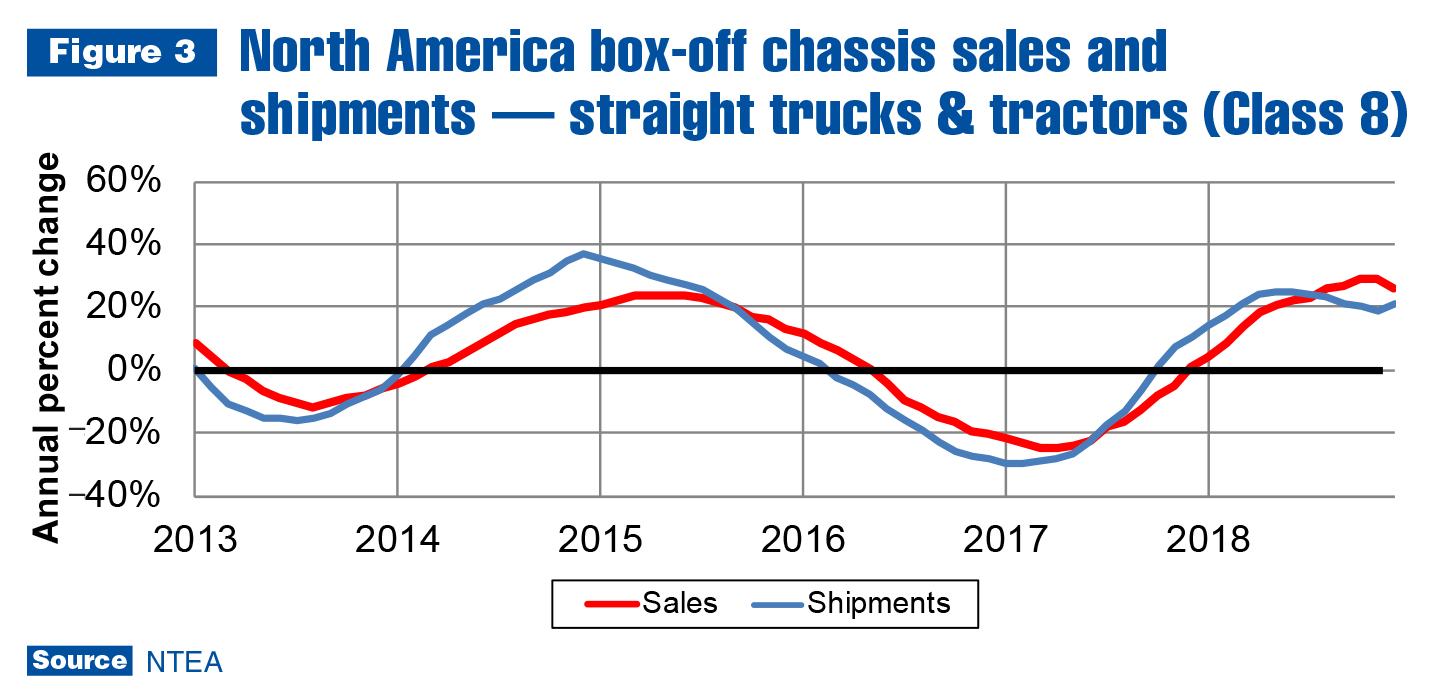
There was a sizable bounce in Class 8 shipments in December, but the rate of sales growth peaked. Therefore, it’s unlikely the shipments growth rate will accelerate in the first half of 2019. OEM expectations for Class 8 sales will temper additional growth in shipments as the annual rate of growth decelerates throughout 2019.
Most commercial truck industry segments had a good year in 2018. U.S./Mexico chassis sales increased 4 percent in total (although, not all industry segments rose at the same rate). Growth in Classes 6–8 more than outweighed declines in Classes 2–5. (Note, fourth-quarter growth accelerated only in Classes 2 and 8.) Commercial truck chassis sales are expected to continue rising in 2019 as sales in Classes 2–5 drop a bit more, and Class 6–8 sales increase a bit less. In total, sales are expected to grow about 2 percent.
In Canada, chassis sales rose 8 percent in 2018 — twice the rate registered in U.S./Mexico. Classes 3 and 6 were the only two weight classes to register sales declines for the year. In the fourth quarter, sales growth was accelerating in Classes 2, 6 and 8. In total, though, as was the case for U.S./Mexico, sales growth was decelerating at the end of the year. Class 3–8 sales growth is expected to continue declining in 2019 and fall to about 5 percent.
Metals and energy prices
Metals prices were still growing at the end of the year on an annual basis, but as of the fourth quarter, were falling on a quarter-to-quarter basis. This was the case for all steel prices included in Figure 4. Hot-rolled steel sheet/strip prices rose 21.3 percent in 2018, but fell 1.8 percent in the fourth quarter. Through the third quarter, prices were up closer to 25 percent, which meant the industry essentially pushed prices up enough to cover the cost of the 25 percent tariff imposed in April 2018.
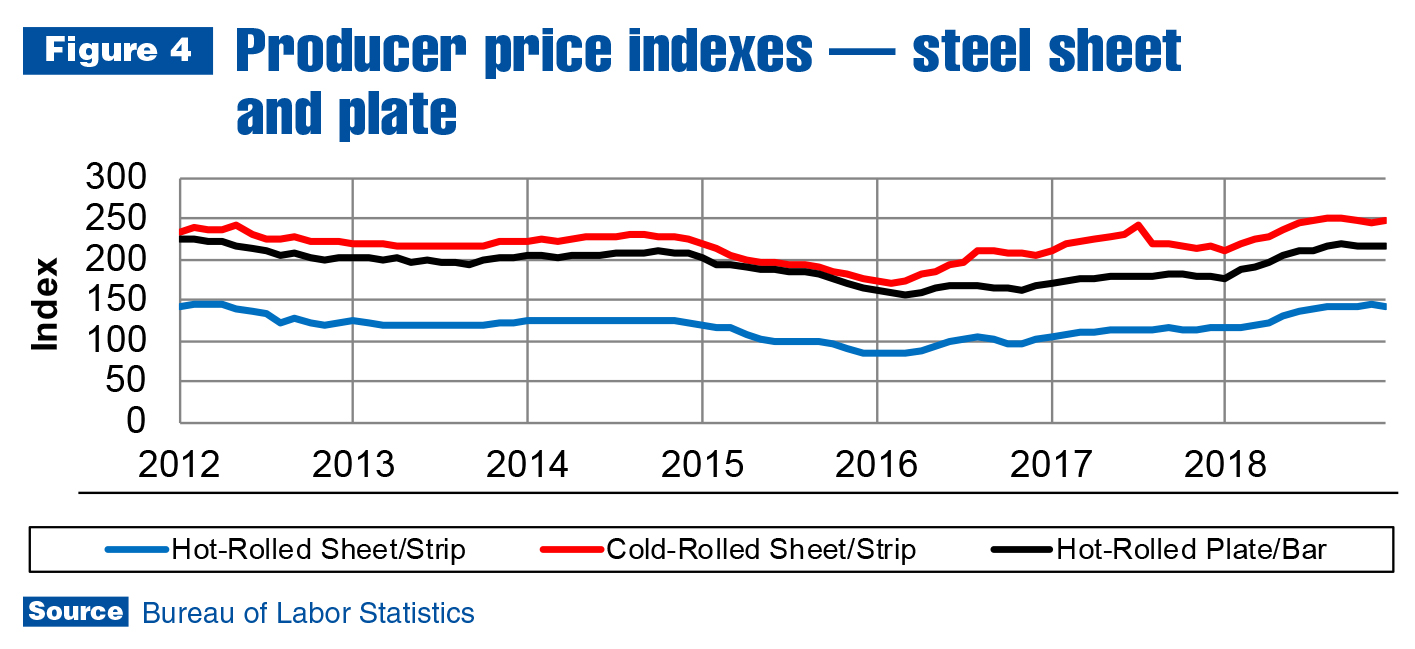
Once tariffs were priced in, though, market forces started pushing prices back down — primarily due to global overcapacity. The largest factor is China, which created an enormous amount of steel production capacity to support construction activity from 1990–2015. When it was obvious the country overbuilt, the Chinese tried exporting the steel they no longer needed to the rest of the world. There wasn’t enough demand, and in the last two years, China shuttered many of those plants. Nevertheless, global capacity remains too high.
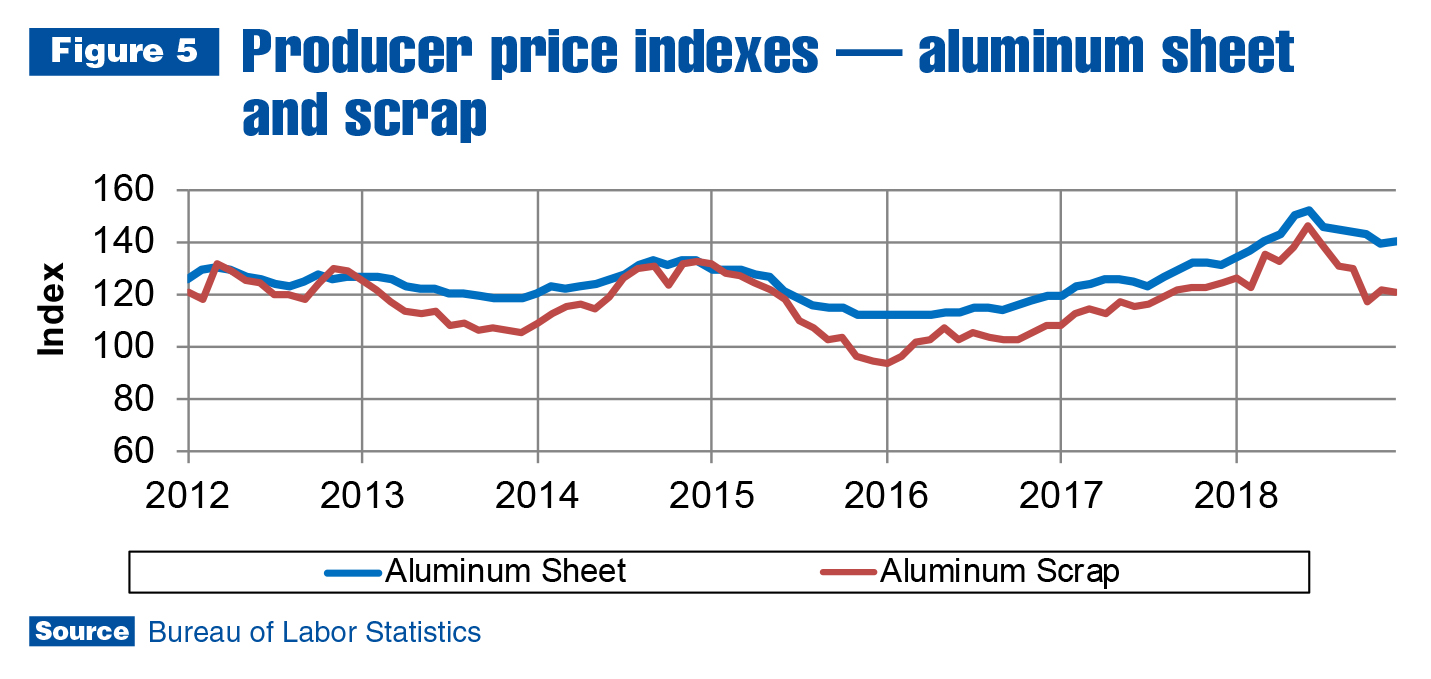
It’s a different story in the aluminum industry, including the role played by China, which accounts for only 2 percent of global exports. Aluminum prices rose throughout 2017 and the first half of 2018 as a result of global economic growth. The 10 percent tariff was barely noticed. As the global economy cooled in the second half of 2018, aluminum sheet prices were up only 7.2 percent for the year and fell 2.6 percent in the fourth quarter. Scrap prices dropped 6.9 percent in the fourth quarter, which means sheet prices will probably continue falling in the first half of 2019.
In the market for oil, prices have been climbing again. As of the end of February, the Brent spot price was close to $57 per barrel. Saudi Arabia again indicated it would cut supply, and is encouraging other members of OPEC to do so as well. Russia will likely follow suit. Due to political instability in Venezuela, its contribution to global supply has fallen drastically. Additionally, economic sanctions imposed on Iran have had a marginal negative impact on the country’s contribution to global supply. To summarize, current upward pressure on the price of oil will likely remain through 2019. NABE’s forecast calls for the Brent spot price to rise to $67 by the end of the year.
Leading indicators
Housing starts reached 71.7 thousand units in December — almost 10,000 units less than December 2017 (an 11.9 percent drop). This pulled fourth-quarter growth down to –6.7 percent. For the year, starts were up just 3.6 percent — about a full percentage point behind the National Association of Home Builders (NAHB) forecast. For 2019, NAHB anticipates less than 1 percent growth, which can be attributed to three factors.
- Millennial incomes have grown more slowly than home prices for the past five years.
- Prices will not likely fall much this year.
- Interest rates will probably rise in 2019, making monthly payments higher and, therefore, less affordable.
Nonresidential building is expected to rise 4.5 percent in 2019, partially due to expectations that U.S. Congress will pass an infrastructure bill. If this doesn’t occur, business owners in all U.S. economic sectors may be looking to expand capacity in 2019. The tight labor market will continue to make it difficult. There should be greater availability of construction workers in 2019 as demand for residential housing stabilizes; however, finding labor to staff a new plant will remain challenging.
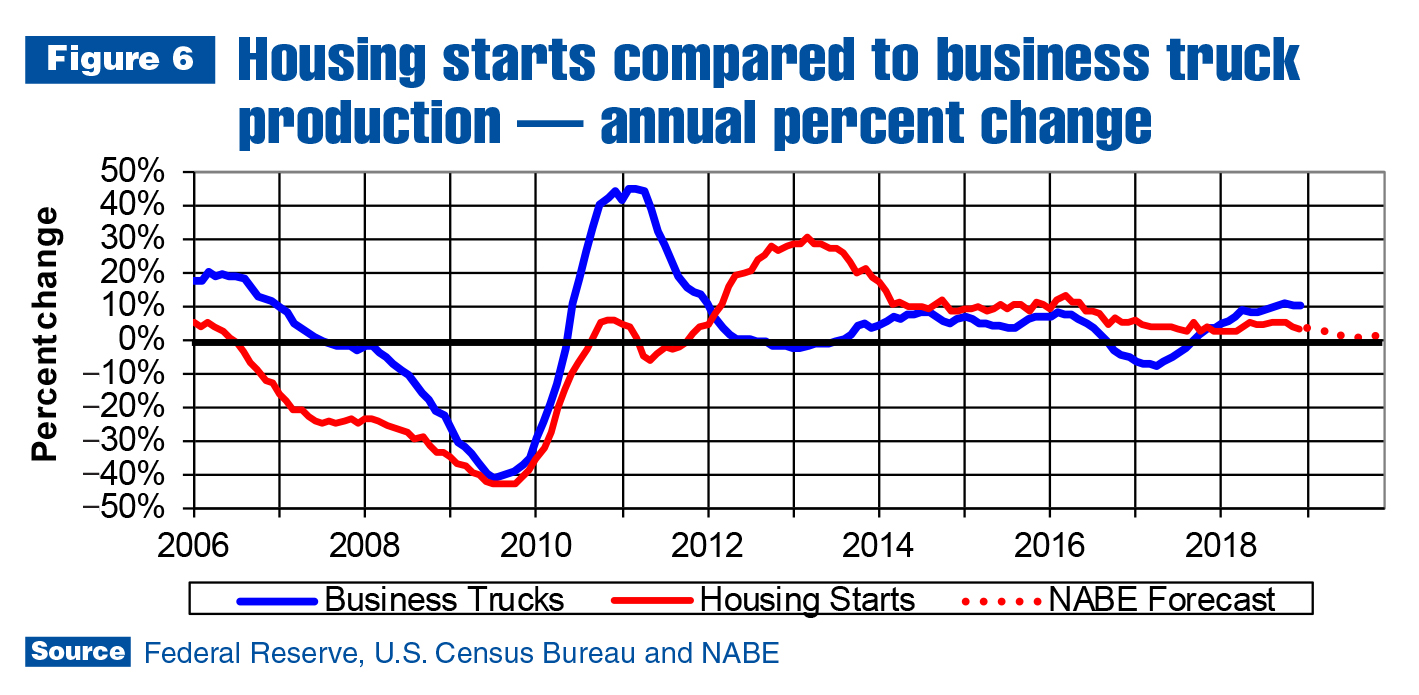
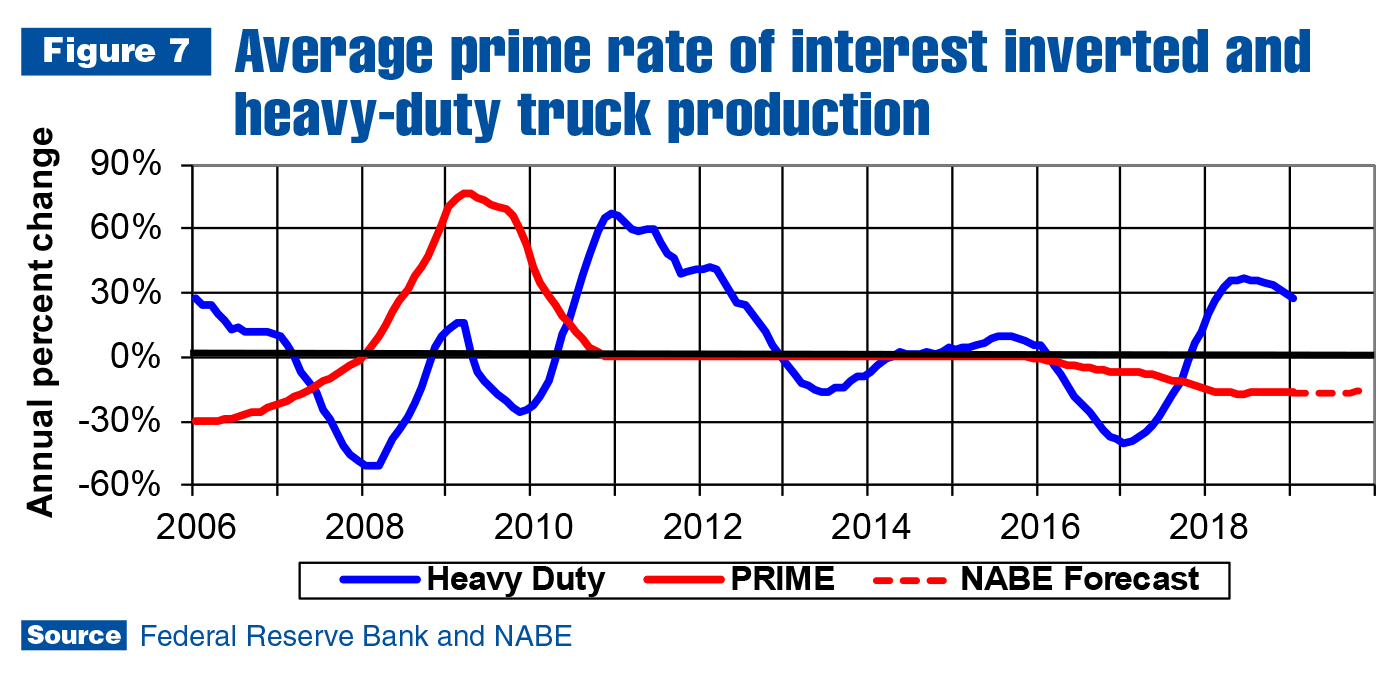
Figure 6 shows heavy-duty commercial truck chassis and tractor production peaked in terms of annual growth. The next annual decline in sales will likely occur in 2020, and the next intersection of the truck data and interest rate series will happen sometime after the truck series falls below the zero line. This will signal the heavy-duty cycle trough is about one year away.
This is consistent with the current IHS Markit forecast for 4 percent Class 8 sales growth in 2019 and 14 percent decline in 2020. Total Class 3–7 sales are expected to climb 2.3 percent in 2019 and fall 3.7 percent in 2020. Total commercial truck chassis sales are predicted to be flat in 2021–2022 and then start growing again in 2023.
For more industry market data, visit ntea.com/marketdata.