By Steve Latin-Kasper, NTEA Director of Market Data & Research
Meet our experts
This article was published in the March 2020 edition of NTEA News.
Key highlights
- The labor market will likely become even tighter throughout the 2020s.
- Businesses need to consider how potential employees are likely to perceive the entire work experience, not just the wage.
- Labor market dynamics in the 2020s and beyond are expected to continue putting upward pressure on wages and benefits.
According to results of a Federal Reserve Bank of Atlanta survey, wages for the bottom 25% of workers (in terms of hourly pay) rose 4.5% between November 2018 and November 2019. For the top 25%, the wage increase was 2.9%. Per national salary surveys conducted at the end of last year, wages are generally expected to continue rising in 2020, at about a 3% rate.
It wasn’t a shock to learn wages increased over the course of 2019, but the surprise was employees at the lower end of the wage scale received larger percentage increases than those at the high end. This can primarily be attributed to new local/state minimum wage laws, a tight labor market and job-hopping.
Around the U.S., 29 states and Washington, DC, mandated an hourly minimum wage higher than the $7.25 federally mandated minimum. This isn’t particularly relevant to the work truck industry, since the average industry wage tends to be higher than minimum wage, but on a national level, it’s contributing to upward pressure on wages.
More importantly, the tight labor market will likely become even tighter throughout the 2020s, which will put even more upward pressure on wages. And that means job-hopping will become more problematic, not less. It’s important to note, though, while a higher wage is a primary reason an employee leaves one company for another, it’s not the only reason. For many, health benefits and work environment are just as important as wage/salary. In this hyper-competitive market for labor, businesses need to consider how potential employees are likely to perceive the entire work experience, not just the wage.
Moving from one employer to another is nothing new, of course. It has long been accepted as normal at higher wage/salary levels. What’s different is the propensity to change employers is now common at lower wage/salary levels as well. This has been an issue for years in the freight forwarding industry, which has been struggling with employee turnover rates greater than 100% (a key reason the industry has been so interested in driverless vehicle technology).
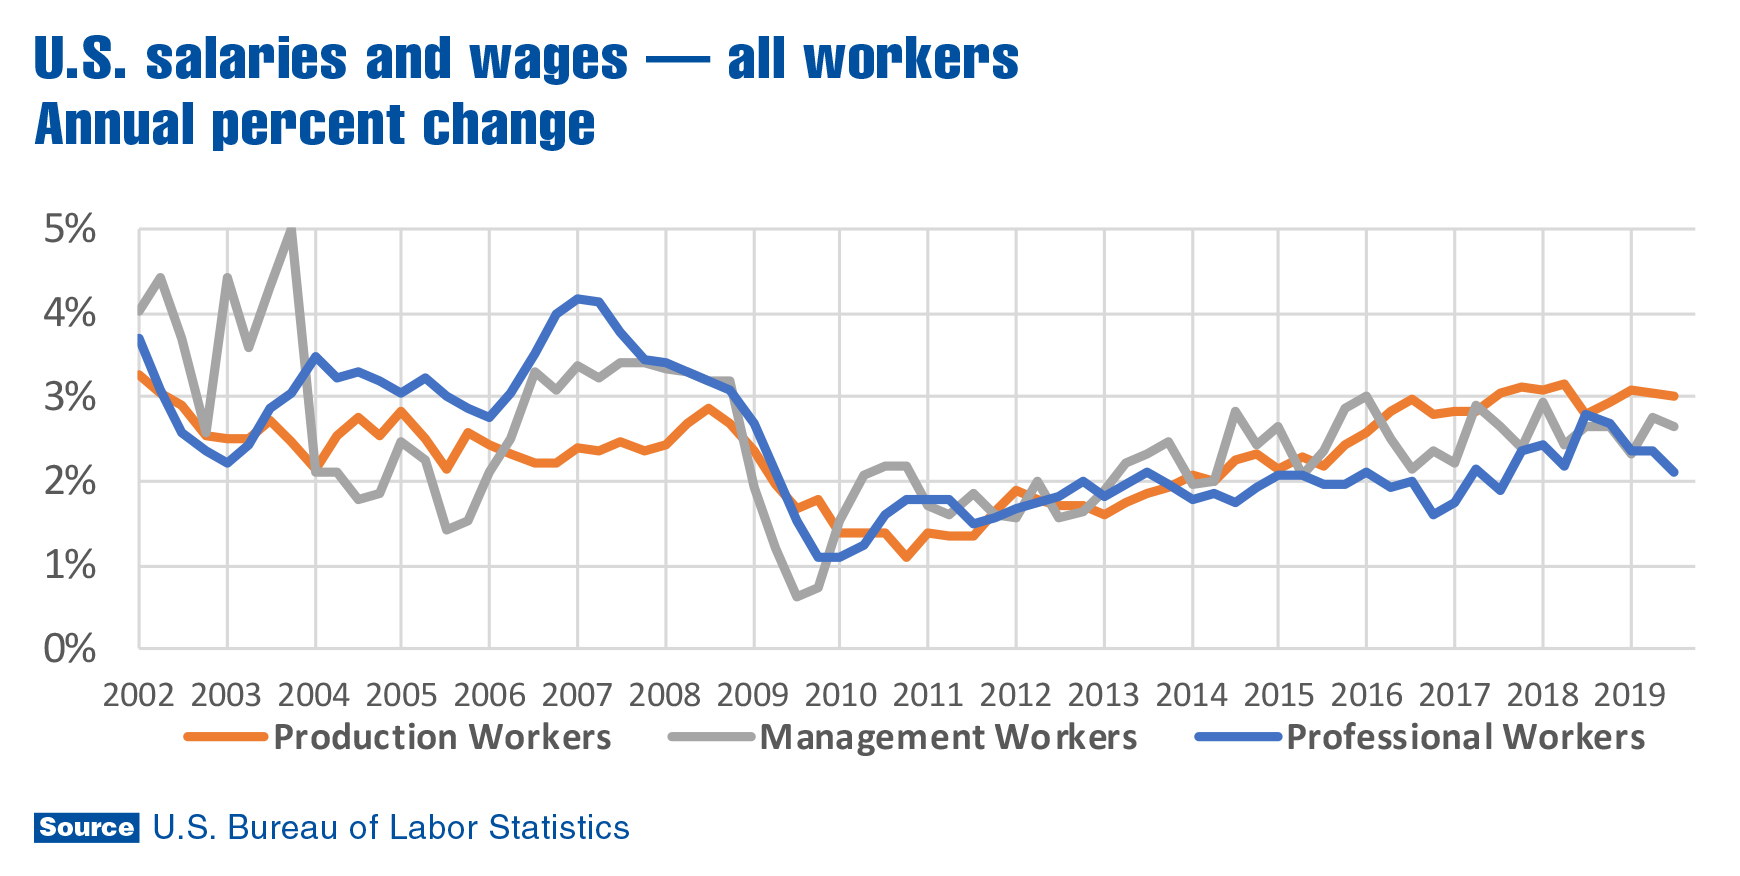
In the chart above, U.S. wage changes are viewed from a different perspective. While Atlanta Fed data was segmented by wage rates, Bureau of Labor Statistics (BLS) employment cost index data is segmented by broadly defined worker categories. Production employees would generally be most closely associated with the bottom 25% of wage earners previously referenced.
BLS data clarifies several points. First, it’s been a long time since production worker wages grew faster than professional and management wages. Additionally, production worker wage growth accelerated from 2010–2018, but remained steady at about 3% since then. Since 2016, professional worker wage growth has been the most volatile. It didn’t increase as much as the other categories from 2010–2016, but then accelerated from 2017 through the first half of 2018, and decelerated through the third quarter of 2019.
As Baby Boomers keep retiring at a rate of almost 4 million per year through the 2020s, professional and management market segments will both likely be volatile. Some industries will be more affected than others, since they were more attractive to Baby Boomers when they started their careers. This means labor availability imbalances between industries, which may cause employers to continue upping the ante to attract workers from other companies.
It’s highly likely labor market dynamics in the 2020s and beyond will continue putting upward pressure on wages and benefits. As a result, employers in the work truck industry (and throughout the rest of the economy) may want to take this into consideration in their planning processes.
For more industry market data and statistics, visit ntea.com/marketdata.