By Steve Latin-Kasper, NTEA Director of Market Data & Research
This article was published in the July 2017 edition of NTEA News.
U.S. economy
The U.S. economy grew at an annual 1.2 percent rate in the first quarter of 2017, as reported in the second gross domestic product (GDP) estimate from Bureau of Labor Statistics (BLS). Primary drivers of continued growth were personal consumption expenditures (PCEs) and residential investment. State and local government spending declined slightly in the first quarter.
While the slow growth rate was no surprise, the steep decrease in change in private inventories (CIPI) caught most economists off guard. CIPI measures the change in physical volume of inventories — additions less withdrawals — that businesses maintain to support production and distribution activities. It usually rises prior to economic improvement.
The first-quarter drop in CIPI was unexpected because the measure increased in the fourth quarter of 2016 after trending down for the previous six quarters. Most end-of-year forecasts indicated CIPI reached a cyclical trough in the third quarter of 2016 as a result, and predicted it would start trending up.
A partial reason for the first-quarter decline relates to the tight labor market causing economic difficulties. When construction contractors can’t hire enough labor to support orders for new houses, there is no reason for them to order more building materials. But the impact doesn’t stop there.
Fewer new homes built leads to increased demand for existing housing, causing prices to rise. As a result, newly forming families buying the higher priced dwellings end up spending a larger-than-expected percentage of income on their homes — which means they won’t spend as much on other goods and services as they would have previously. House inflation causes slower growth in PCE on goods and services, which drives growth in the rest of the economy.
As of May 2017, the U.S. unemployment rate was 4.3 percent (it’s been 5 percent or lower since September 2015). The number of new nonfarm payroll jobs created in that timeframe was just under 4,000. This is a good number, but is only 62 percent of the 6,418 jobs created from September 2013–April 2015 — more evidence indicating the tight labor market is limiting expansion.
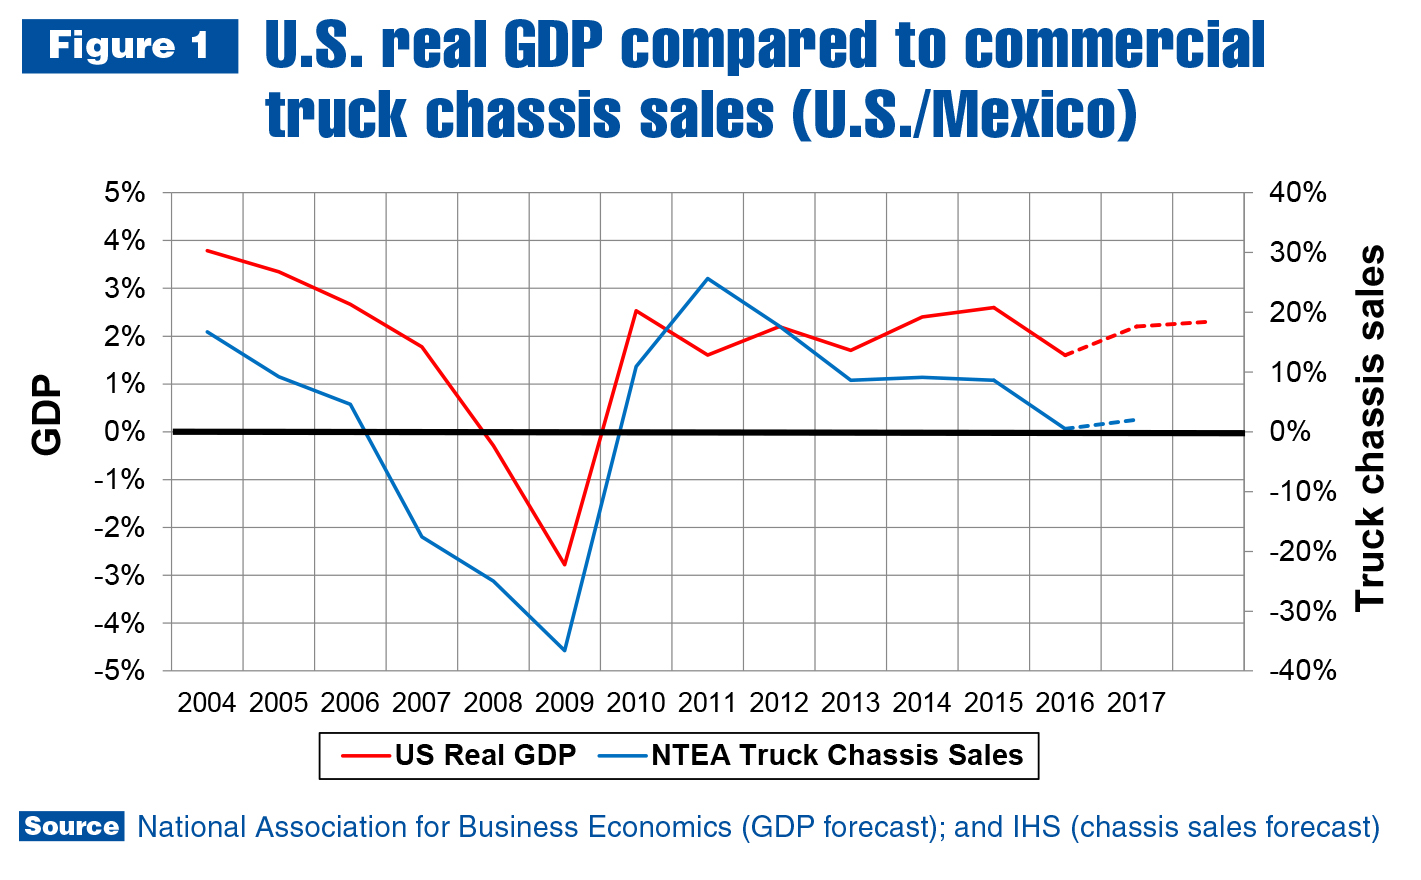
In the work truck industry, and throughout the rest of the economy, this has become an accepted fact of life. Business owners are focused on finding ways to up production by increasing productivity. As this continues, they will be able to boost shipments and sales. As of June 2017, the forecast for the second half of the year calls for higher commercial truck chassis sales than in the first half. Sales are still expected to rise 2 percent compared to 2016.
Work truck industry
U.S./Mexico commercial truck chassis fell 2.2 percent in the first quarter of this year — well below predictions. The decline was not industry-wide; it was concentrated in the conventional and cutaway cab types, as well as Classes 4–5 and 7–8. Sales rose in Classes 2–3 and 6. In total, commercial truck chassis sales fell 2,216 units in the first quarter.
The second quarter started off with a bang in April, as cutaway and conventional chassis sales together increased about 1,450 units. Combined with a jump of around 1,130 units in the strip and low cab-over-engine (LCOE) segments, –2.2 percent cumulative sales growth in March became 0.3 percent growth through April.
It was a good sales month for most weight classes, but not all. The largest positive changes in cumulative growth rates between March and April occurred in Classes 4 and 5. In Class 4, the rate changed from –7.9 percent to –0.7 percent as sales shot up almost 20 percent in April. In Class 5, the cumulative rate of growth went from –4.7 percent to 1.3 percent as a result of 20+ percent growth that month.
Class 2 was the exception to the rule. It was the fastest growing weight class in the industry in the first quarter at an 11.5 percent rate. In April, though, sales declined at a 32.4 percent rate, driving the cumulative rate down to –5.1 percent and making it the worst-performing weight class through the month, with the exception of Class 8.
In Canada, commercial truck chassis sales also rose in April, at a 6.9 percent rate. Segments contributing to Canadian growth were different than the U.S./Mexico market. An increase of more than 300 units in the conventional cab chassis sector accounted for most of the growth with some help from LCOE. Strip and cutaway sales fell.
Relative to the U.S./Mexico, Canadian Class 2 sales went in the opposite direction in April, rising more than 100 percent and pushing the cumulative rate up to almost 80 percent. In cumulative terms, Classes 3 and 5–6 registered gains through April. Classes 4 and 7–8 were down for the year.
In the NAFTA market, tractor sales were down again for the month (cumulatively, about 20 percent). Sales are expected to improve in the second half of 2017. In the commercial van segment, sales fell in April, but remained up about 6 percent for the year.
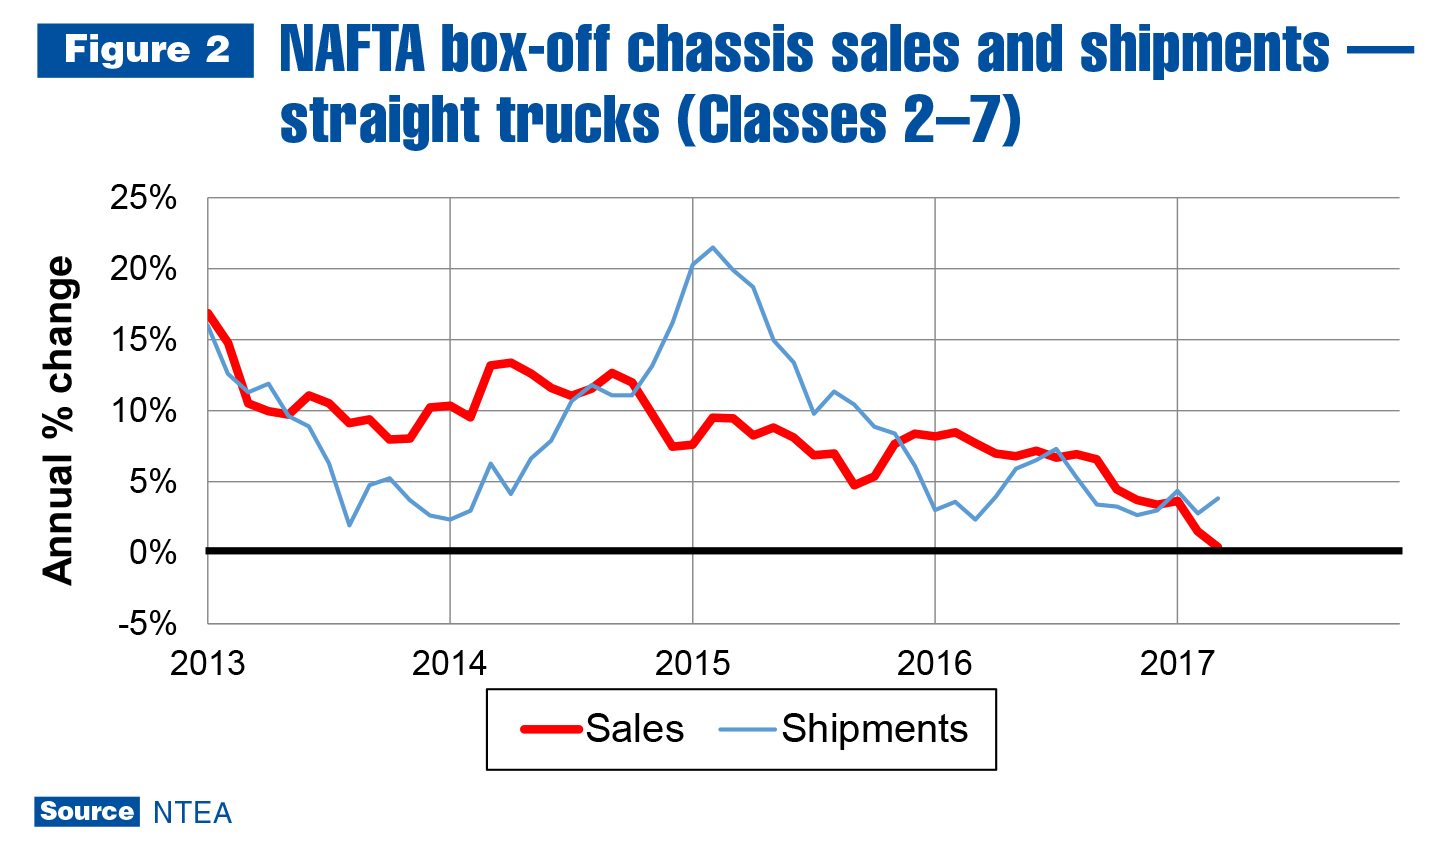
As shown in Figure 2, the Class 2–7 sales growth rate has been trending down since the second quarter of 2014 in the NAFTA market. This is partially attributed to ongoing slow growth in the U.S. and Canadian economies, with a tight labor market and low oil prices contributing factors. As of this year, oil prices have stabilized and business owners are finding ways to adjust to low availability of skilled labor. The Class 2–7 growth rate is anticipated to stabilize in the second or third quarter of 2017 and start trending up in the fourth quarter.
Metals and energy prices
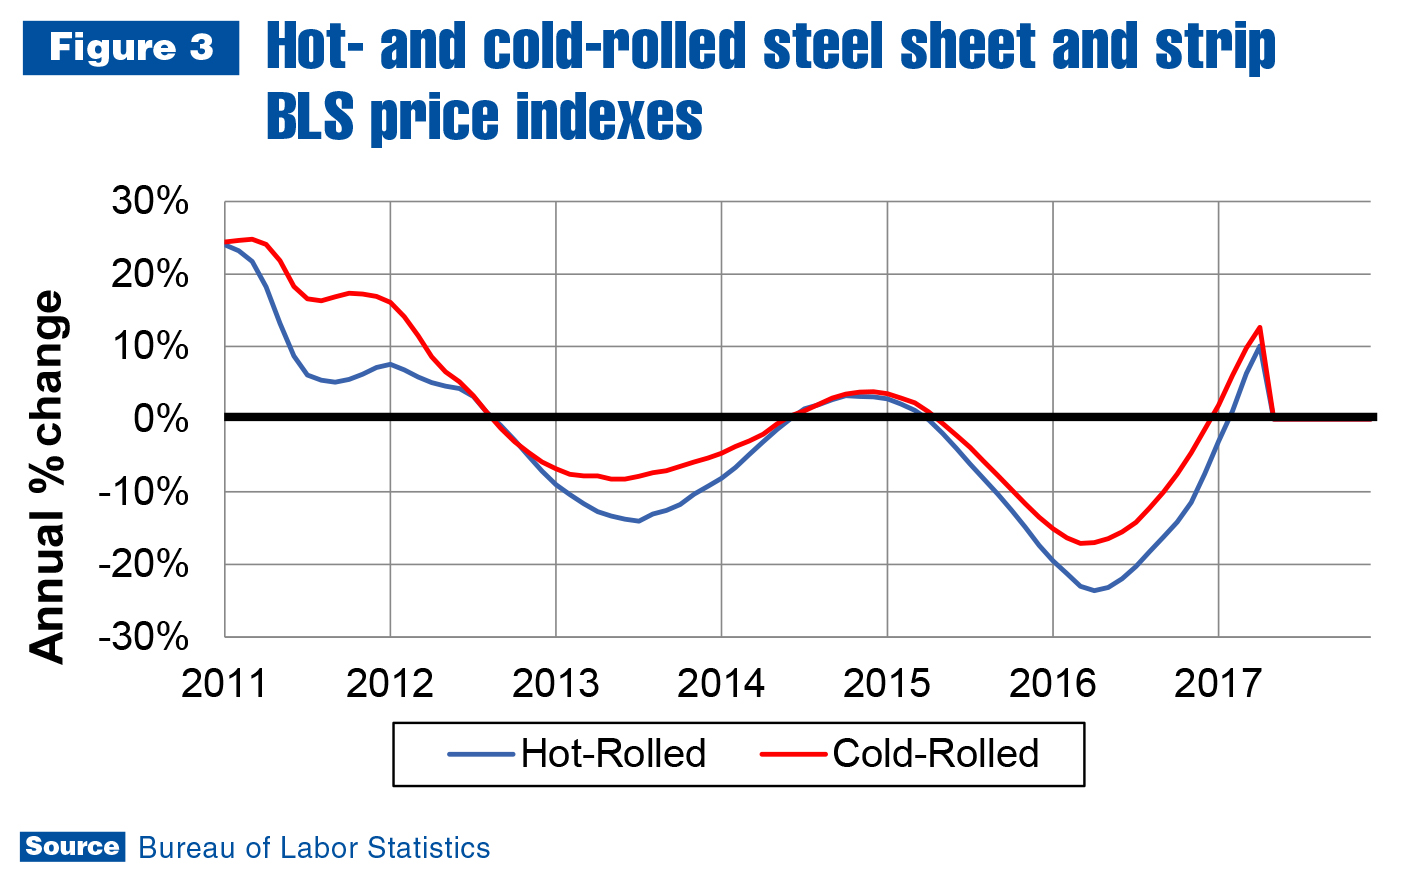
As illustrated in Figure 3, steel prices fell for two years from the beginning of 2015 to the end of 2016 — but the trend changed dramatically in the first quarter of 2017. Hot-rolled steel sheet/strip prices were up about 10 percent in the first quarter as compared to the same quarter in the previous year. Cold-rolled steel sheet/strip prices increased about 12 percent. Prices have not yet peaked, but the rate of growth may stabilize in the second or third quarter.
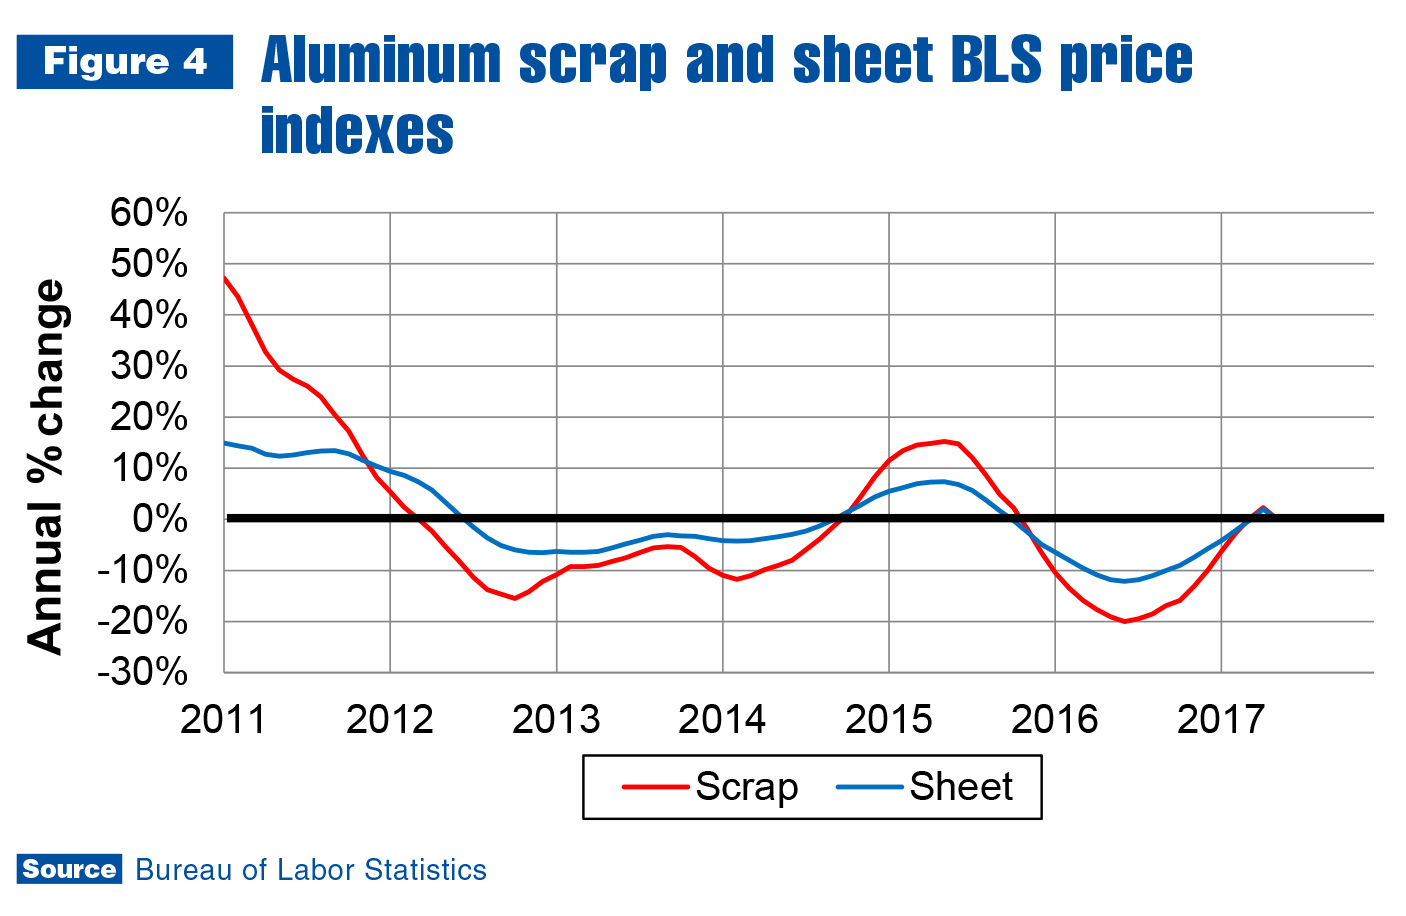
Aluminum sheet prices didn’t decline for as long as steel before turning up again in the first quarter. Scrap prices — typically a leading indicator of sheet prices — were accelerating a bit faster than sheet at the end of the first quarter. This likely means sheet prices will continue accelerating at least through the third quarter of this year.
As of April, the Brent spot price per barrel of oil was $52.31 — a 25.8 percent increase from the $41.58 April 2016 monthly average. In the most recent quarter, though, the price fell 4.2 percent, and U.S. average diesel and gasoline prices rose. Rising demand for fuel is an indication of the nation’s continued economic expansion. Gasoline prices climbed much faster than diesel between January and April, which mirrors the state of the U.S. economy. Consumers are contributing more to growth than businesses.
Leading indicators
There were significant limitations preventing the U.S. economy from reaching its potential GDP in the first half of 2017. The construction industry was likely more substantially impacted by the tight labor market than most other sectors. Housing starts continued rising, but for the third consecutive year, were behind forecast.
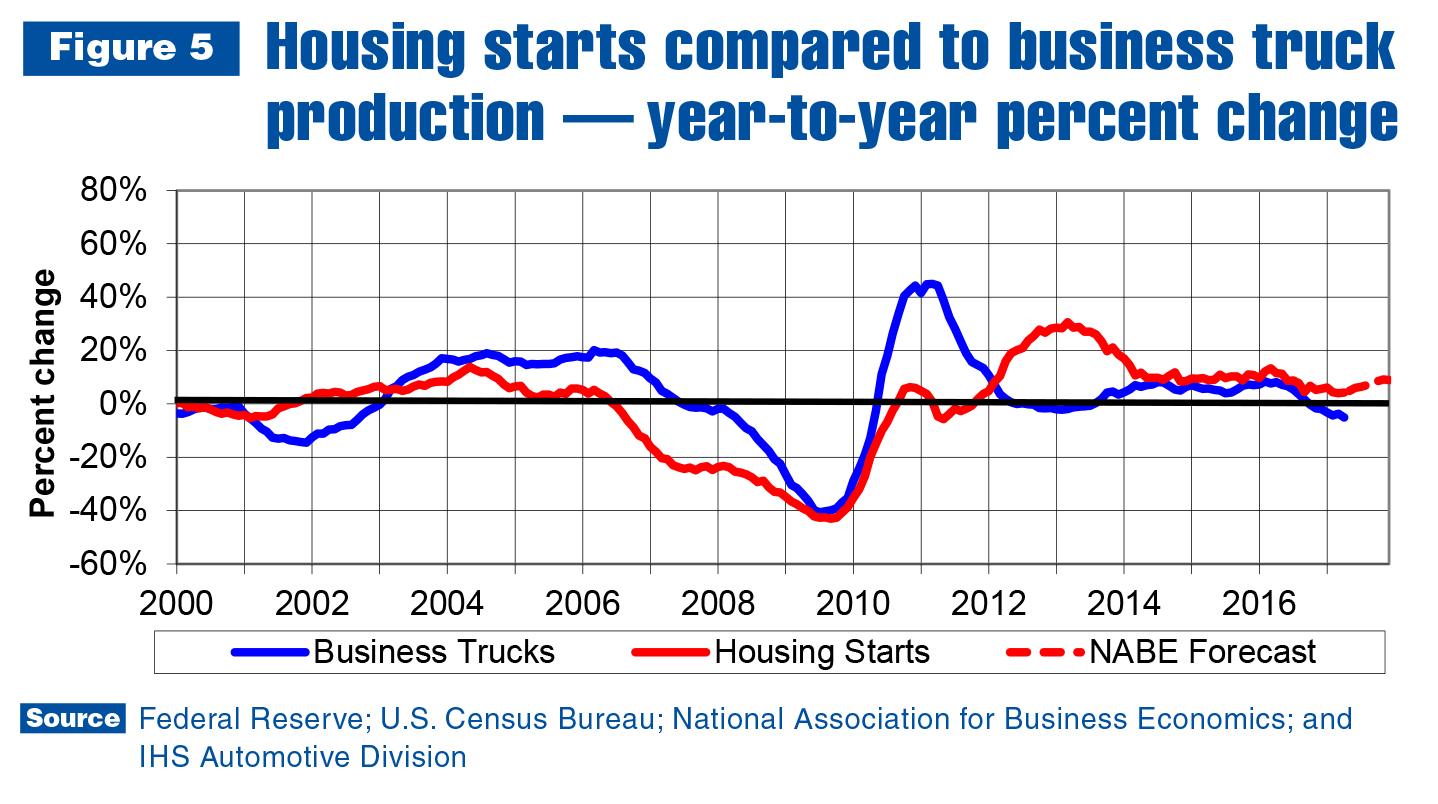
Housing starts grew at about a 5 percent rate through April of this year, as shown in Figure 5 — a total projected to be closer to 10 percent. Per the forecast, housing starts were anticipated to reach approximately 1.28 million. On current trend, it will be closer to 1.23 million — a difference of about 50,000 units. There is likely enough pent-up demand to absorb those 50,000 units; there just isn’t enough labor to build them.
The constrained need for new houses is being partially vented in the market for existing homes — resulting in swiftly increasing prices. It is once again a sellers’ market. Prices can only go so high, though, as a percentage of average income, before they cause demand to start decreasing.
This may be hastened by rising interest rates. As detailed in Figure 6, the yield curve (difference between two- and 10-year Treasury bill rates) has been sliding back toward zero since last November. About half of the improvement made between June and November has been lost, and the trend is clearly down.
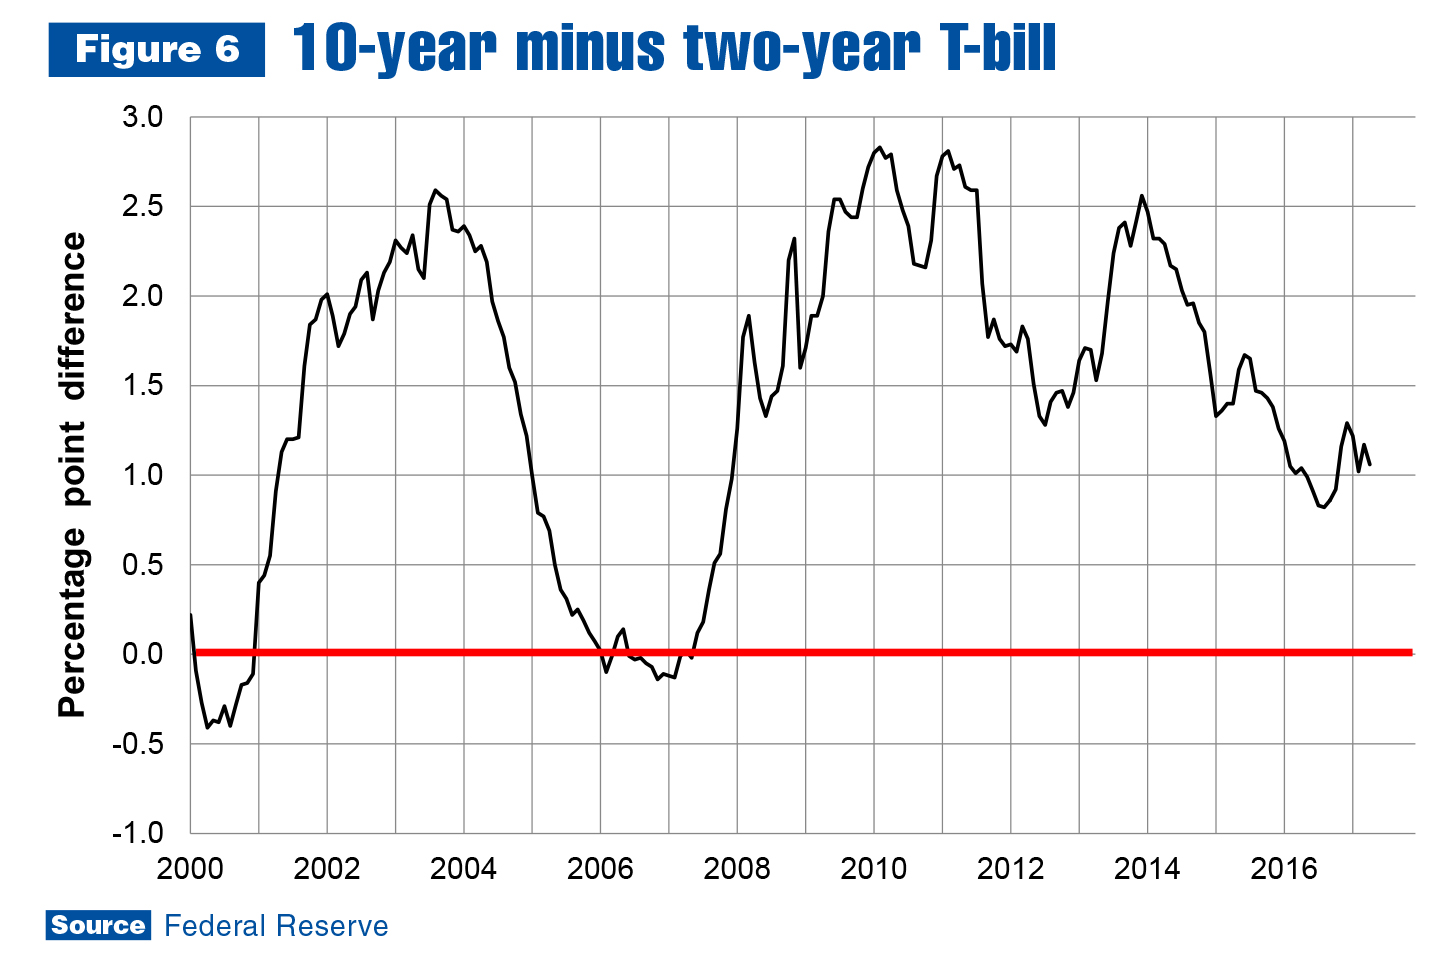
The yield curve is falling because the 10-year rate is increasing more slowly than the two-year. On current trend, it is unlikely to drop below zero — which indicates the U.S. economy will enter recession about one year later — before the fourth quarter of 2018. Assuming the yield curve stays on trend, the next recession probably won’t start before the fourth quarter of 2019. Consensus economic forecasts continue to indicate it will occur sometime after that.
What this means for the work truck industry is there will probably be at least two or three more years of growth. However, the rate of growth will almost certainly remain slow.
If you have any questions or comments about this article, contact Steve Latin-Kasper. For additional resources and statistics to help your company plan for the future, login to ntea.com/marketdata. There, members can find information on U.S. truck sales and registrations; box-off truck chassis production and shipments data; commodity pricing; global commercial truck market data; leading industry indicators and forecasts; and more.