 By Steve Latin-Kasper
NTEA Director of Market Data &
Research
stevelk@ntea.com
This article was published in the October 2015 edition of NTEA
News.
U.S./Mexico commercial truck chassis sales grew at a
rate of 4.6 percent in the second quarter as compared to the same period last
year. This result is also down from 18.8-percent in the first quarter. As of
June 2015, the cumulative increase was 10.8 percent — slightly better than
the 10.3-percent registered as of June 2014. Overall, year-to-year work
truck industry growth was still accelerating, but declining on a quarterly
basis. As of the third quarter, expectations of continued chassis sales growth
remain high, but the prospective rate of increase seems to be in
flux.
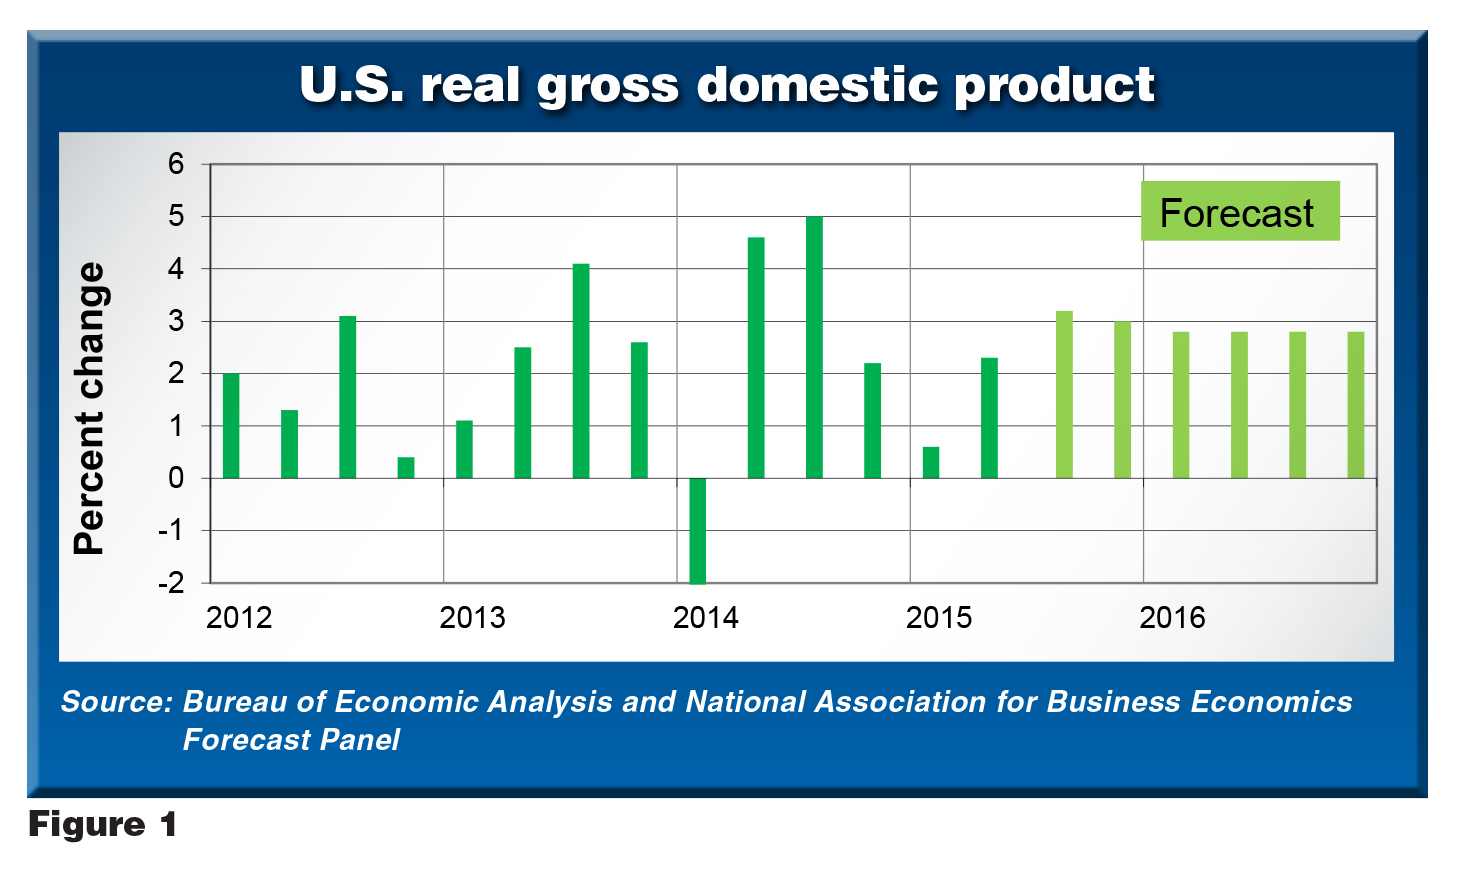
In the U.S. economy, the anticipated growth rate also
remains variable. In its most recent revision, the Bureau of Economic Analysis
(BEA) reported the U.S. economy didn’t decline in the first quarter but actually
rose 0.6 percent. The BEA first reported a 2.3-percent estimate of
second-quarter growth, but this was substantially revised up to 3.7 percent in
the recently published second estimate based on more complete data. While this a
good number, it’s still a significant decline from the 4.6-percent growth in the
second quarter of 2014. In short, U.S. economic development accelerated from the
first to second quarter of 2015 but slowed down as compared to the second
quarter of last year.
While the trend is not clear for the work truck industry
and U.S. economy, both will continue growing in the second half of 2015.
Anecdotal evidence indicates chassis orders remain at high levels, and OEMs are
running multiple shifts on their assembly lines. In the U.S. economy, retail
sales are still rising, and construction activity is increasing.
The economy is benefitting from low unemployment and
inflation levels. In fact, the unemployment rate fell to 5.1 percent in August,
down from 5.3 percent in July and near what economists call the full
employment level of unemployment. Through July, the inflation rate
(excluding energy and food) was about 1.7 percent — considered a positive level
by policymakers at the Federal Reserve (Fed). Some industries are not doing well
in the U.S. economy — especially the oil sector. However, the Fed’s public
comments regarding national economic health have been optimistic for the last
three months.
Slow wage and income growth is the one domestic
macroeconomic factor negatively influencing the economy, but the situation may
have reached a turning point in August. The September Bureau of Labor Statistics
(BLS) monthly jobs report which indicated the U.S. economy created another
173,000 payroll jobs in August also noted the average wage increased 0.3 percent
between July and August. This amounts to 3.3-percent growth annually, but one
month’s change does not constitute a trend. In terms of BEA and BLS data, the
good news outweighed the bad, making it more likely the Fed will begin the long
process of slowly raising interest rates.
Work truck industry
Commercial
truck chassis sales in the NAFTA market rose 18.7 percent in the first quarter
of the year as compared to the same period in 2014. In the second quarter, sales
continued rising but at a lower rate of 6.1 percent. The forecast for the rest
of the year remains positive, but the growth rate is expected to be slower in
the second half than in the first.
In the U.S./Mexico market, strip and cutaway chassis
sales fell 1.1 percent and 2.2 percent, respectively, in the second quarter.
Strip sales were still down slightly for the year. However, due to fast growth
in the first quarter, cutaway sales remained up by almost 20 percent.
Conventional cab and low cab-over-engine chassis sales both registered increases
in the second quarter at rates of 9.2 percent and 5.3 percent,
respectively.
Second-quarter growth rates varied substantially by
weight class segment in 2015. Class 3 sales fell 6.9 percent as compared to the
second quarter of 2014, while Class 8 sales grew 18.7 percent. Likewise, Class 4
sales fell in the second quarter, while Classes 2 and 5 increased at
single-digit rates. During the same period, Classes 6 and 7 grew at double-digit
rates.
In the U.S./Mexico complete vehicle market, commercial
van sales rose 7.6 percent in the second quarter — down from 51.8 percent in the
first quarter. The cumulative growth rate was 24.1 percent as of June. In the
first half of the year, the tractor segment was the most stable of all industry
sectors. Tractor sales grew 26.2 percent in the first quarter and 22.4 percent
in the second. Through June, they were up 24.1 percent.
Although June 2015 sales fell 27.8 percent as compared
to the same month last year, Canadian commercial truck chassis sales grew faster
in the second quarter than in the first. Big increases in April and May more
than compensated for the decline in June, and sales rose 23.3 percent in the
second quarter as compared to 18.4 percent in the first. All cab-type segments
increased in the second quarter. In terms of weight, Class 3 and 8 sales fell in
the second quarter, while Class 4–6 sales grew about 65 percent. The Canadian
complete vehicle market did not fare as well in the second quarter. Tractor
sales rose only 5.1 percent, while the commercial van segment fell 7.2
percent.
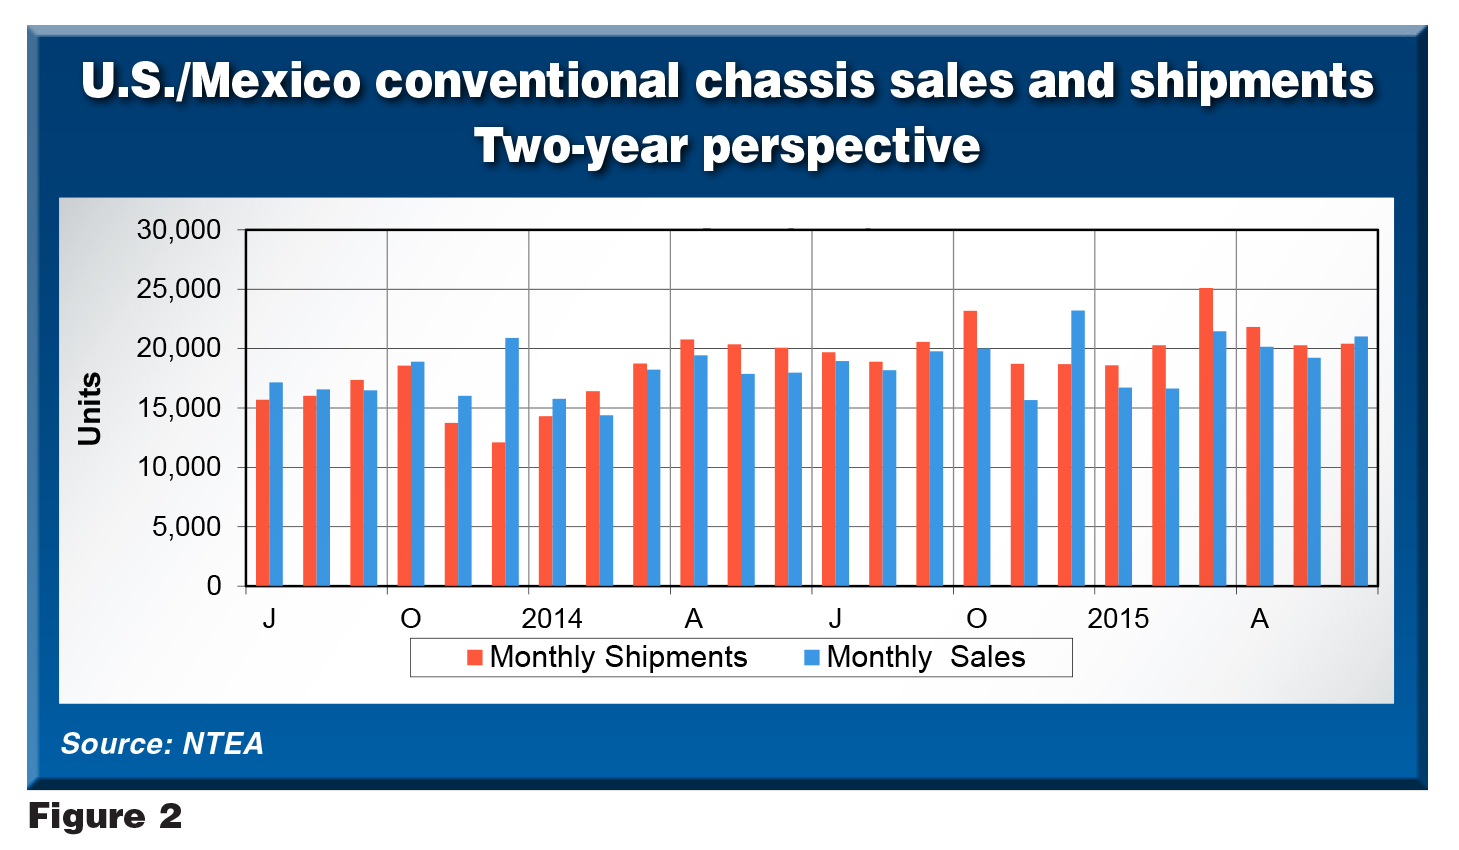
The NAFTA market segment which can be viewed as an
accurate barometer of overall work truck industry performance is the U.S./Mexico
conventional chassis market. As shown in Figure 2, shipments and sales growth
have been steady in the last two years. By the third quarter of 2013, both
shipments and sales averaged about 16,000 units per month. During the same
period in 2014, monthly sales averaged about 19,000 units. This year, as of the
second quarter, they averaged about 20,000 units. In absolute terms, the
increase from one year to the next was smaller. However, Figure 2 shows
shipments outpaced sales in five of the first six months of 2015 — an indication
OEM future sales expectations remain positive and further growth is anticipated.
Third-quarter shipments and sales will probably average nearly 22,000 units per
month.
Metals and energy prices
After
climbing through 2014, aluminum prices fell in 2015. In fact, they dropped as
far in the first six months of this year as they climbed in all of the previous
year. As of June, they returned to January 2014 levels. The decline in aluminum
prices, along with many other commodities prices, can be largely attributed to
China. Estimated Chinese demand for aluminum and other commodities has fallen to
2009 levels in the last six months. Recessions in Russia and Brazil and a slow
recovery in the European Union are also contributing factors.
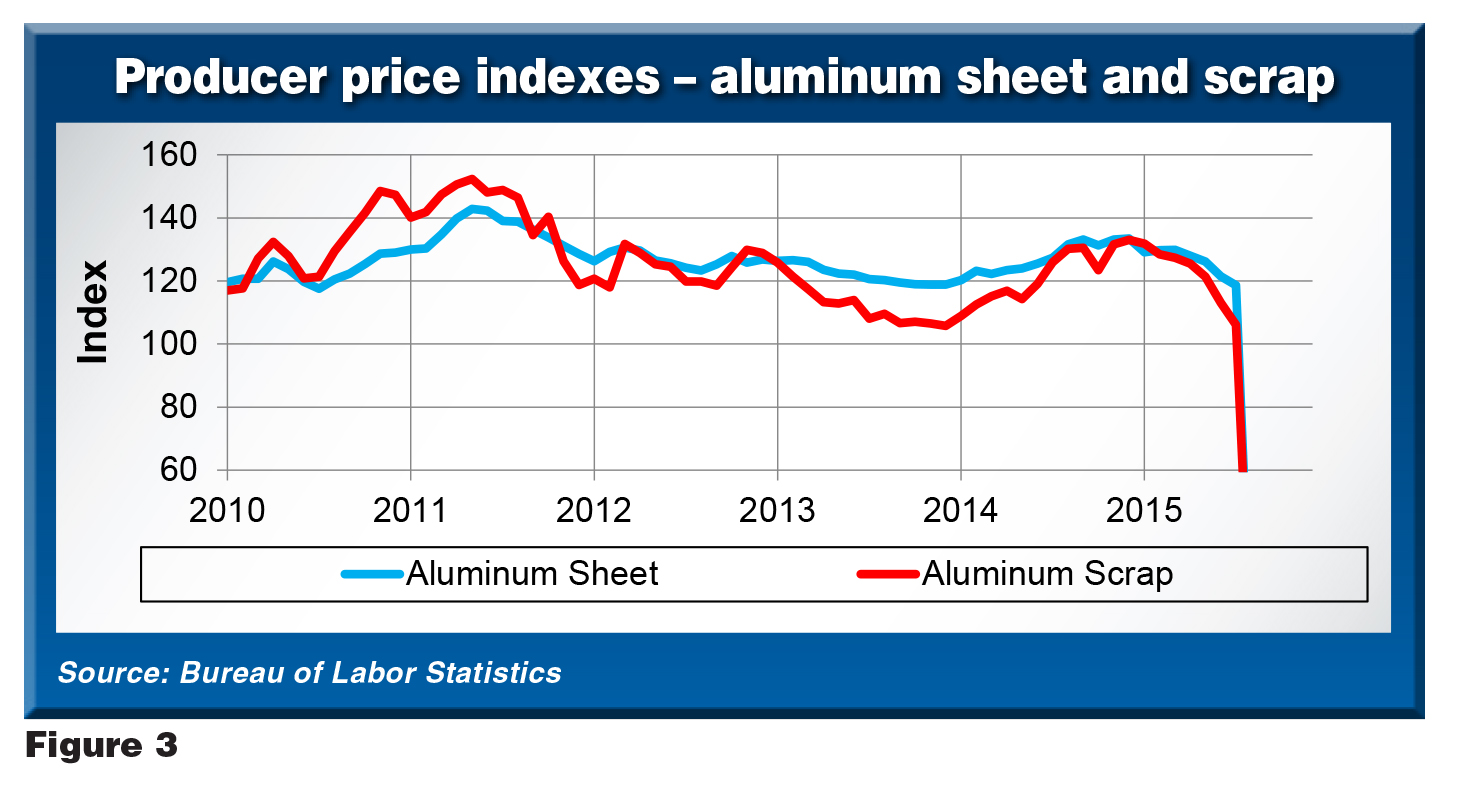
Aluminum prices will likely continue falling through the
end of 2015 and stabilize at some point in 2016. If the U.S. economy keeps
growing and the European Union increases its pace of growth next year as
expected, commodities prices should start rising by the end of 2016. In the long
run, demand for aluminum will increase, at least partially, due to activity in
the automobile industry which is currently transitioning to a bill of materials
including less steel and more aluminum. However, this should impact prices
slowly and predictably as model year changes occur.
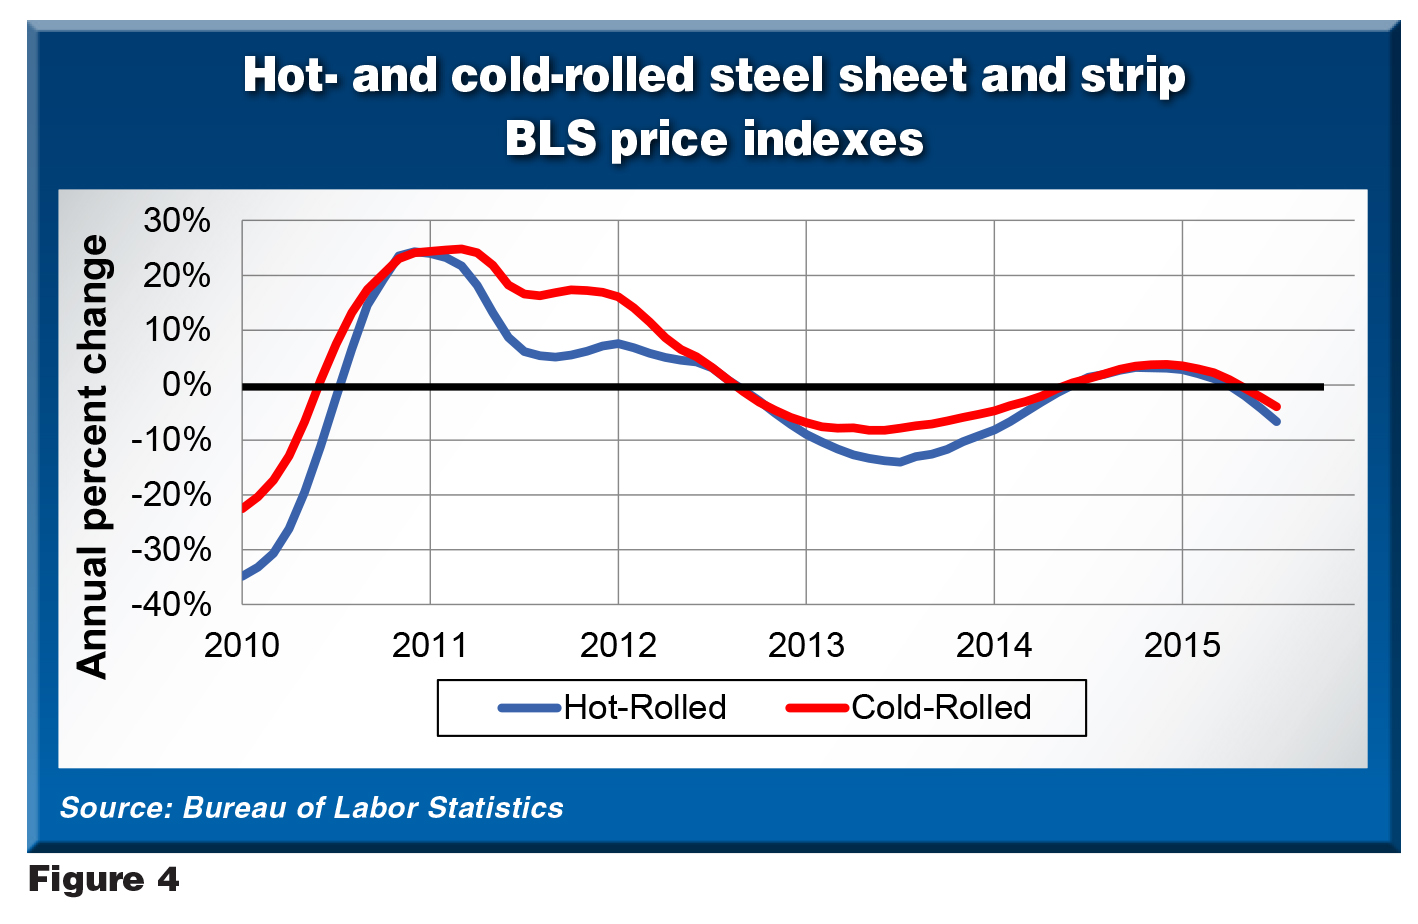
Steel prices started rising slowly in the third quarter
of 2014 and continued increasing through the first quarter of 2015, before
falling in the second quarter due to the same primary reason for the aluminum
price drop. Although the economic slowdown in China strained demand, the actual
state of its economy remains to be seen. Many believe the Chinese economy is
still growing, and a recession remains unlikely through 2016.
In the oil industry, prices are also falling. They
stabilized at about $60 per barrel in the spring, then dropped to about $40 per
barrel, before leveling off again. U.S. diesel and gas prices declined from the
first quarter to the second. Though this trend was expected, it didn’t seem
logical in July. As the Brent Spot Price for oil fell 5 percent between
April and July, the average cost of diesel in the U.S. didn’t change, and
the typical gas price increased almost 13 percent due to greater demand
from consumers. While higher prices did not please consumers, economists considered it an indication of economic health and likely continued
growth.
Leading indicators
The U.S.
economy actually grew at a fast pace in the second quarter. The acceleration in
real gross domestic product (GDP) reflected a rise in exports, boost in personal
consumption expenditures, deceleration in imports, upturn in state and local
government spending, and increase in nonresidential fixed investments. These
factors were partially offset by slowdowns in federal government spending, and
private inventory and residential fixed investments.
Revised second-quarter GDP data may affect consensus
forecasts moving forward, but, as of August, both the Bloomberg and National
Association for Business Economics (NABE) forecast panels predicted U.S. GDP
growth would likely remain less than 3 percent this year and next. Although
cautious optimism remains the order of the day, more growth is
expected.
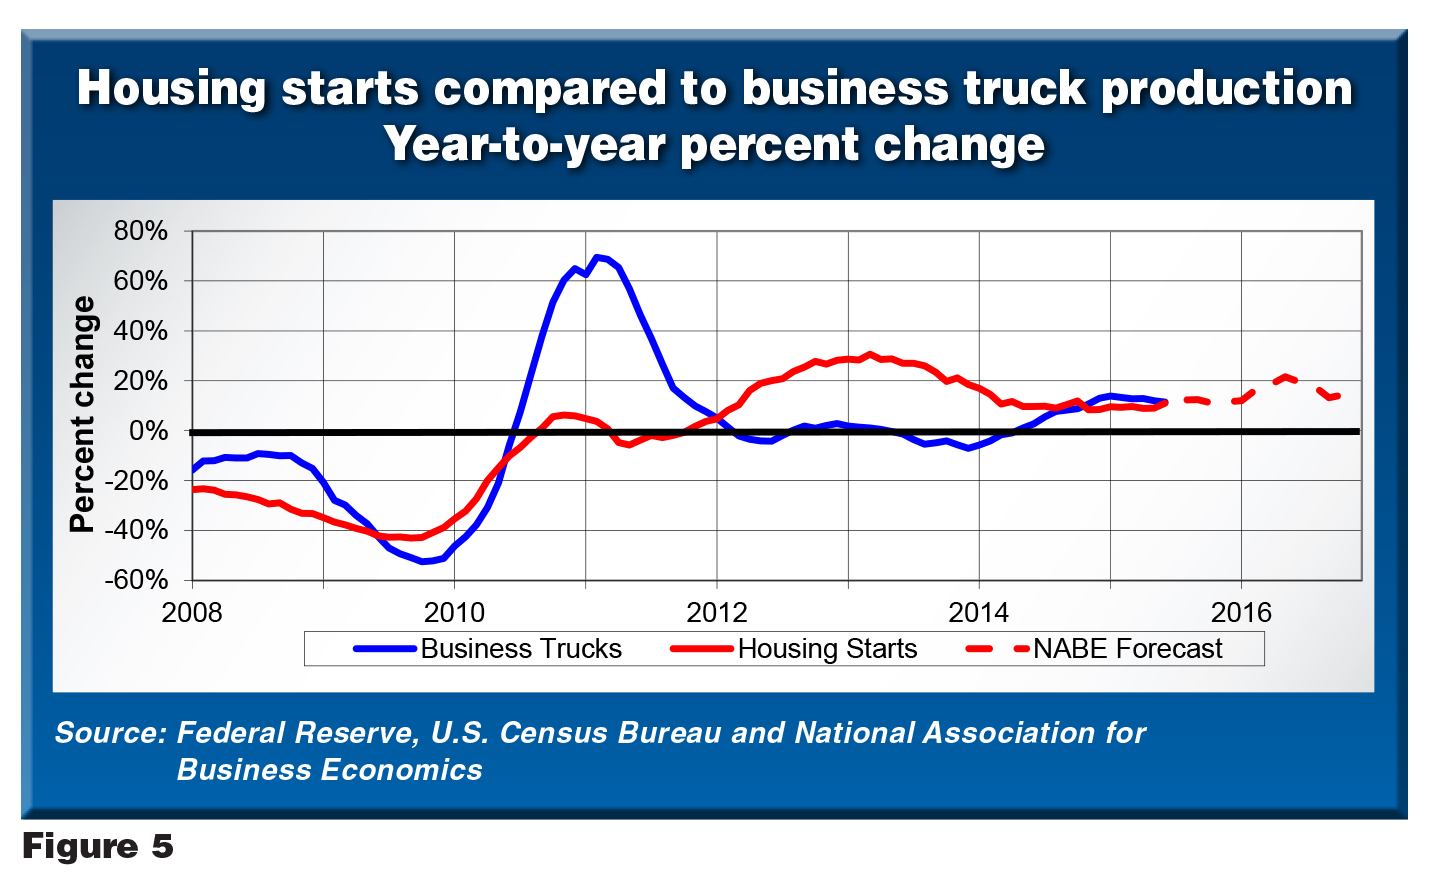
This outlook is reflected in the most recent NABE
forecast for housing starts. The June forecast fell to 1.1 million starts — down
from March’s 1.2 million. Even still, the 2016 estimate remained at 1.3 million.
In summary, the housing market didn’t meet expectations in the first half of
this year, but anticipated potential for 2016 hasn’t changed. Ultimately, 1.1
housing starts in 2015 represents a 10-percent increase as compared to 2014. If
next year’s forecast stays on track, the growth rate will be about 16 percent —
a solid result.
To summarize the U.S. economic forecast, a leading
indicator known as the COLAG — a ratio of the economy’s coincident and lagging
indicators — is helpful. Historically, it has been a good gauge of the economy
and commercial truck sales. Similar to other leading indicators, the
relationship between the COLAG and truck sales weakened due to financial
challenges in 2008.
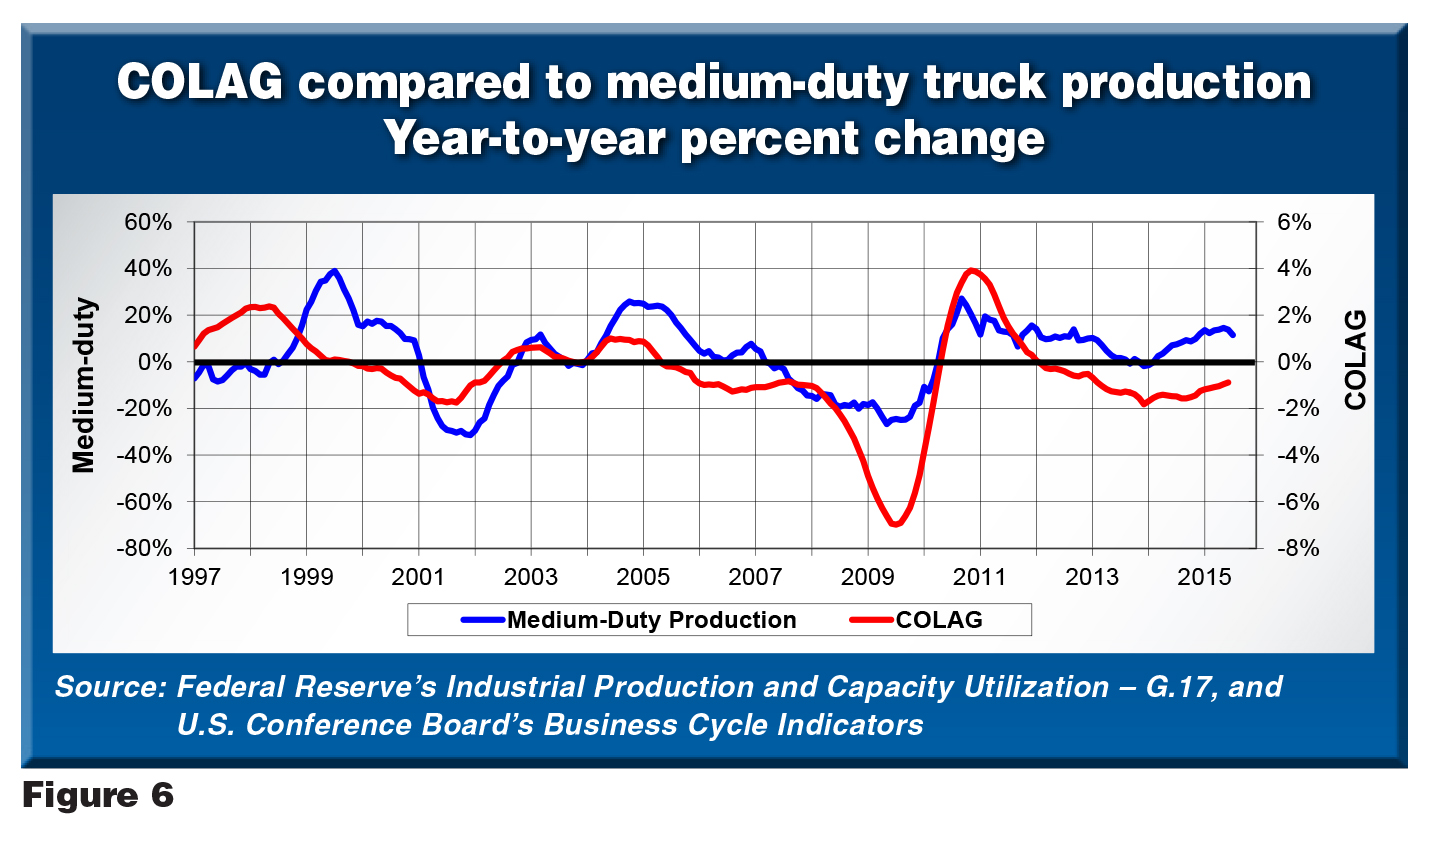
The COLAG includes data representing the labor and financial markets.
These sectors took longer to recover from the recession than others — a trend
reflected in the COLAG. Following labor and financial market activity, it lagged
behind as an indicator. With the labor market improving and banks starting to
behave more normally, the COLAG is beginning to look like a leading indicator
again. As shown in Figure 6, this current cyclical expansion could accelerate.
If U.S. economic growth speeds up, commercial truck and equipment sales
growth will follow suit.