By Steve Latin-Kasper, NTEA director of market data & research
This article was published in the October 2016 edition of NTEA News.
U.S./Mexico sales of commercial truck chassis continued rising in the second quarter of 2016, but at a slower rate than registered in the first quarter. Canada experienced similar results. Sales growth deceleration was due, to some extent, to continued slow growth in the U.S. economy.
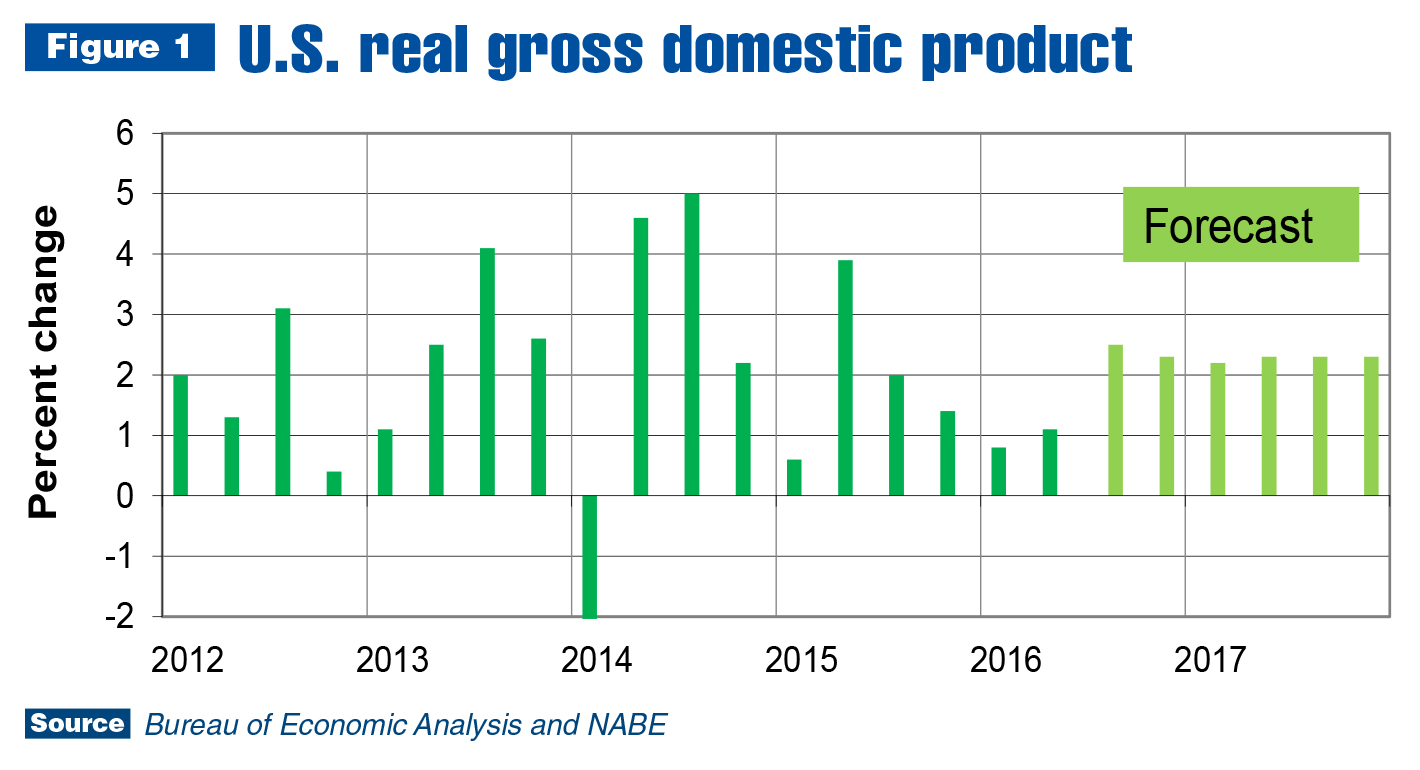
Real gross domestic product (GDP) increased at an annual 1.1 percent rate in the second quarter of 2016, according to the second estimate released by Bureau of Economic Analysis (BEA). This was down slightly from the 1.2 percent reported in BEA’s first estimate. Second quarter growth was slightly faster than the 0.8 percent conveyed by BEA for the first quarter.
This acceleration in real GDP primarily reflected growth in personal consumption expenditures and smaller (than the first quarter) decreases in nonresidential fixed investment and federal government spending. These were partly offset by a larger drop in private inventory investment, and downturns in state and local government spending and residential fixed investment.
Data interpretations have varied widely in business media, but consensus projections barely budged. National Association for Business Economics (NABE) and Bloomberg forecast panels continue predicting slow U.S. economic growth, as reflected in Figure 1.
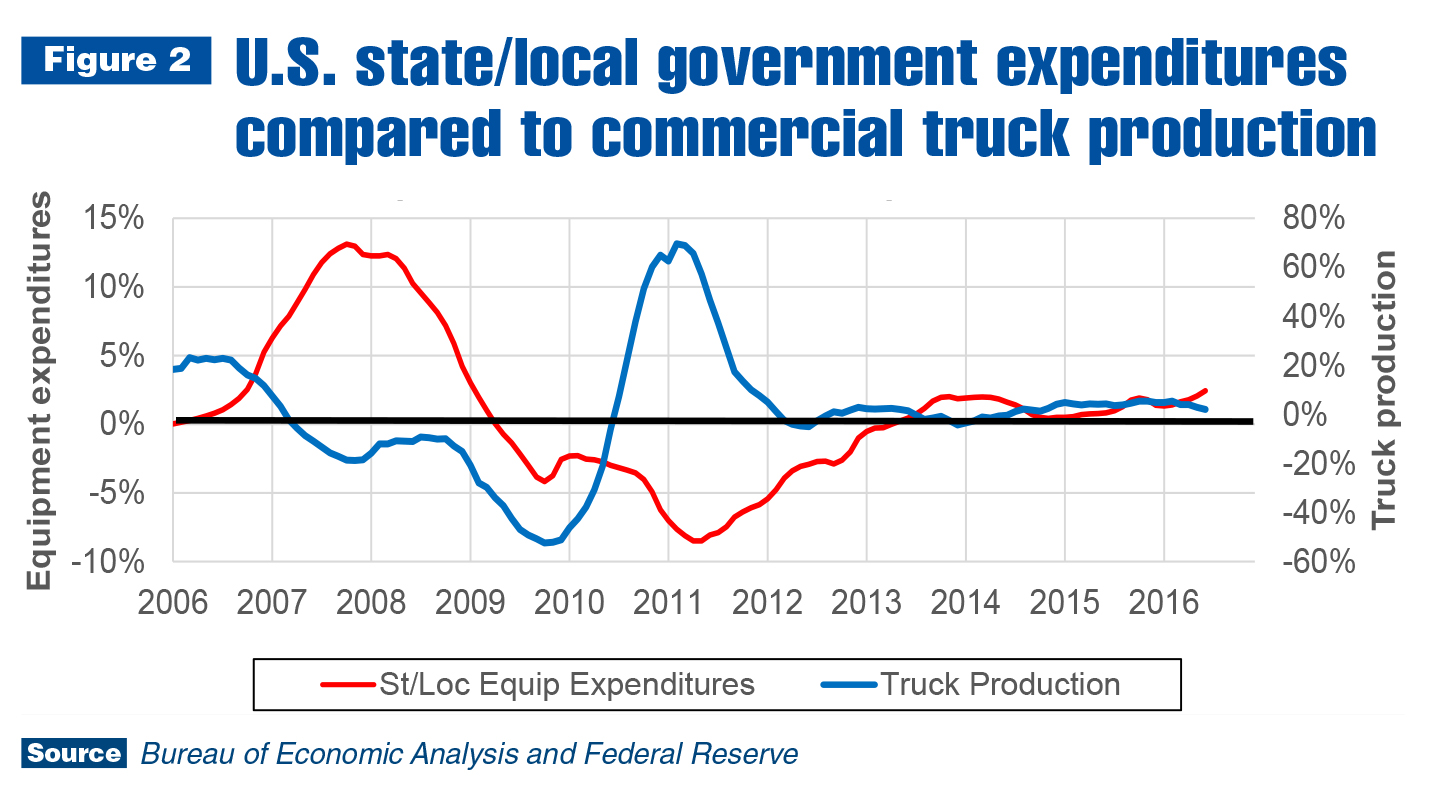
In sum, leisurely growth remains the order of the day for the U.S. In fact, if it wasn’t for consumers, the economy would have contracted in the second quarter. Decreases in state and local government expenditures could cause concern for work truck industry companies. However, the decline is for total state/local expenditures. Spending on equipment, which includes trucks and truck equipment, was still increasing as of the second quarter. In addition, as shown in Figure 2, the rate of growth accelerated.
Work truck industry
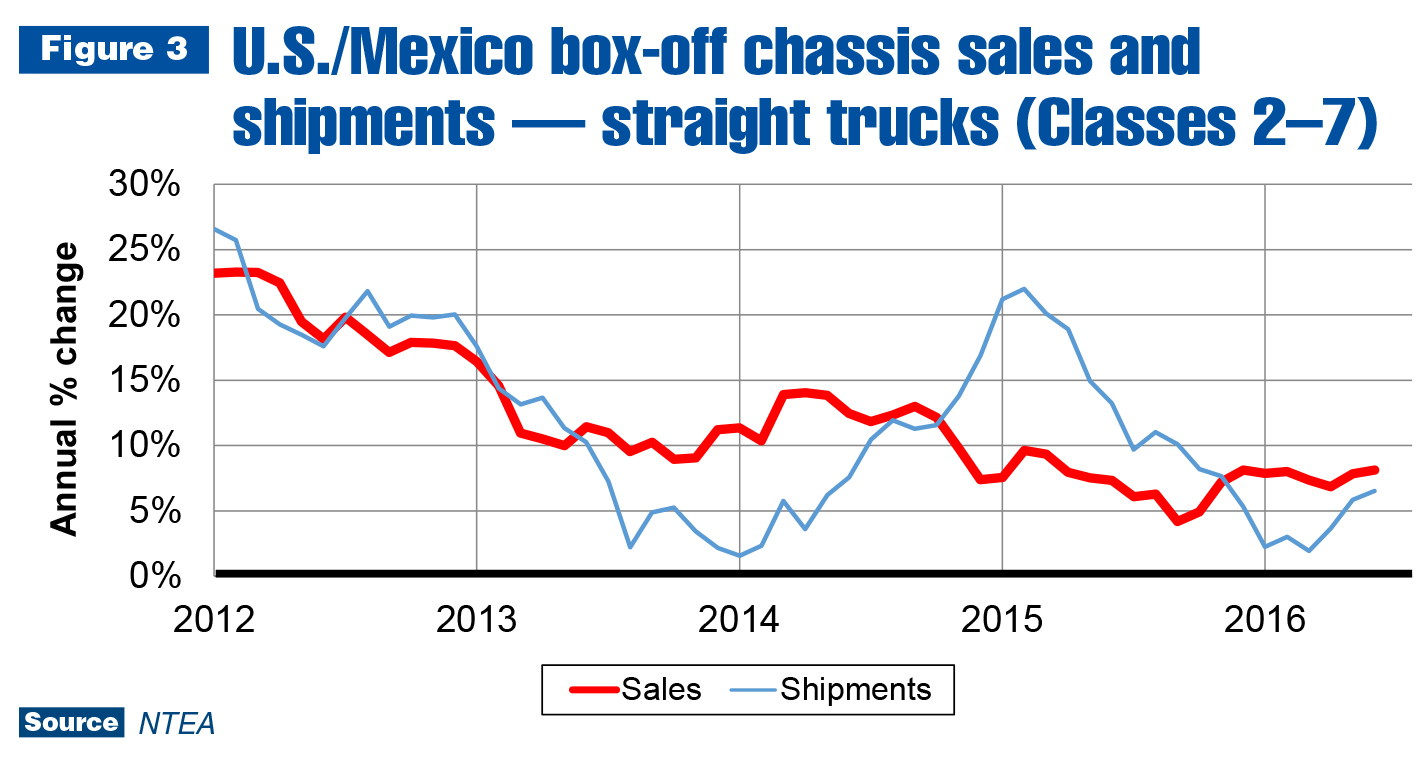
U.S./Mexico commercial truck chassis sales continued rising in the second quarter at a rate of 1.5 percent as compared to the same time period a year earlier. However, due to various economic factors, growth decelerated sharply from the 10.3 percent rate posted in the first quarter. As previously noted, the U.S. economic growth rate remained slow. Other causes include capacity limits and a tight labor market. Commercial truck industry production is near its previous cyclical peak, and anecdotal industry evidence indicates capacity utilization is high. One way to resolve a capacity problem is to add a second or third shift, and many companies are doing so.
Additional shifts come with issues, though, especially when finding qualified labor is difficult. Companies throughout the U.S. are enticing employees away from other businesses, leading to higher wages. This is normal in a long-lasting economic expansion, but doesn’t make the problem any easier to manage. These growth limits aren’t likely to go away before the next recession.
Slower growth was widespread in the second quarter, with rates falling in all cab type segments. The cutaway market registered the least amount of variance as the sales growth rate fell from 4.0 percent in the first quarter to 1.4 percent in the second. Conventional cab sales growth decreased from 10.1 percent to 1.5 percent — and the strip and low cab-over-engine (LCOE) sectors fell more than 15 percentage points.
Growth rates also dropped from the first quarter to the second in most weight classes, except Classes 4 and 7. Class 4 growth rates rose from 13.1 percent to 19.3 percent. Class 7 increased from 7.3 percent to 8.7 percent. In Class 6, sales grew at a 13.2 percent rate — down from 28.2 percent in the first quarter. The largest swing occurred in Class 5, which experienced 0.2 percent growth in the second quarter after jumping 25.2 percent in the first. In Classes 2, 3 and 8, sales fell.
The tractor market, in an ongoing inventory correction, registered sales decreases. After falling 4.9 percent in the first quarter, sales dropped 22.4 percent in the second. Commercial van sales rose 3.6 percent — down from the 14.6 percent increase registered in the first quarter.
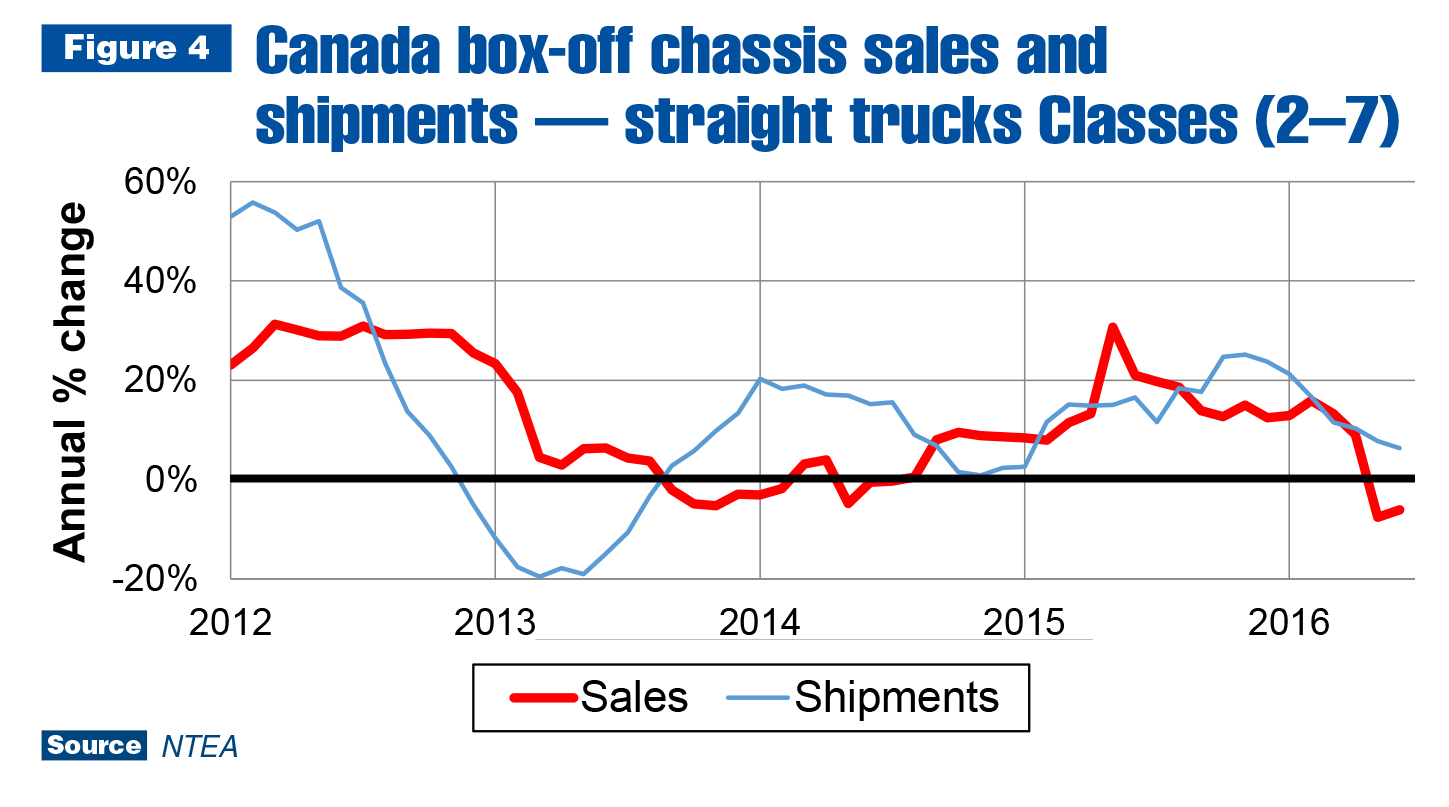
In Canada, commercial truck chassis sales fell 19.9 percent, pushing the growth rate for the year down to –7.3 percent. The only market segments that registered sales increases in the second quarter were cutaway and LCOE cab types, along with Classes 4, 7 and 8. Commercial van sales also increased, at a rate of 18.5 percent.
Metals and energy prices
U.S. steel prices continued rising in July. From May to July, hot-rolled sheet/strip prices increased 15.5 percent compared to the same quarter of 2015. For the year, hot-rolled sheet/strip prices were up 1.8 percent. As of the first half of 2016, it appeared steel price growth would taper off later in the year as a result of global excess capacity, but as of September, the sector remained hot.
The primary reason for rising steel prices at the beginning of the year was China’s construction industry having low inventory at the end of 2015. This occurred in other Asian countries as well. Restocking, along with continued slow growth in the global economy, led to price increases. That didn’t prevent some Chinese steel manufacturers from going bankrupt, though, which affected global capacity. As a result, steel prices will likely remain higher than they would have otherwise (industry analysts expect prices to rise slowly through 2019).
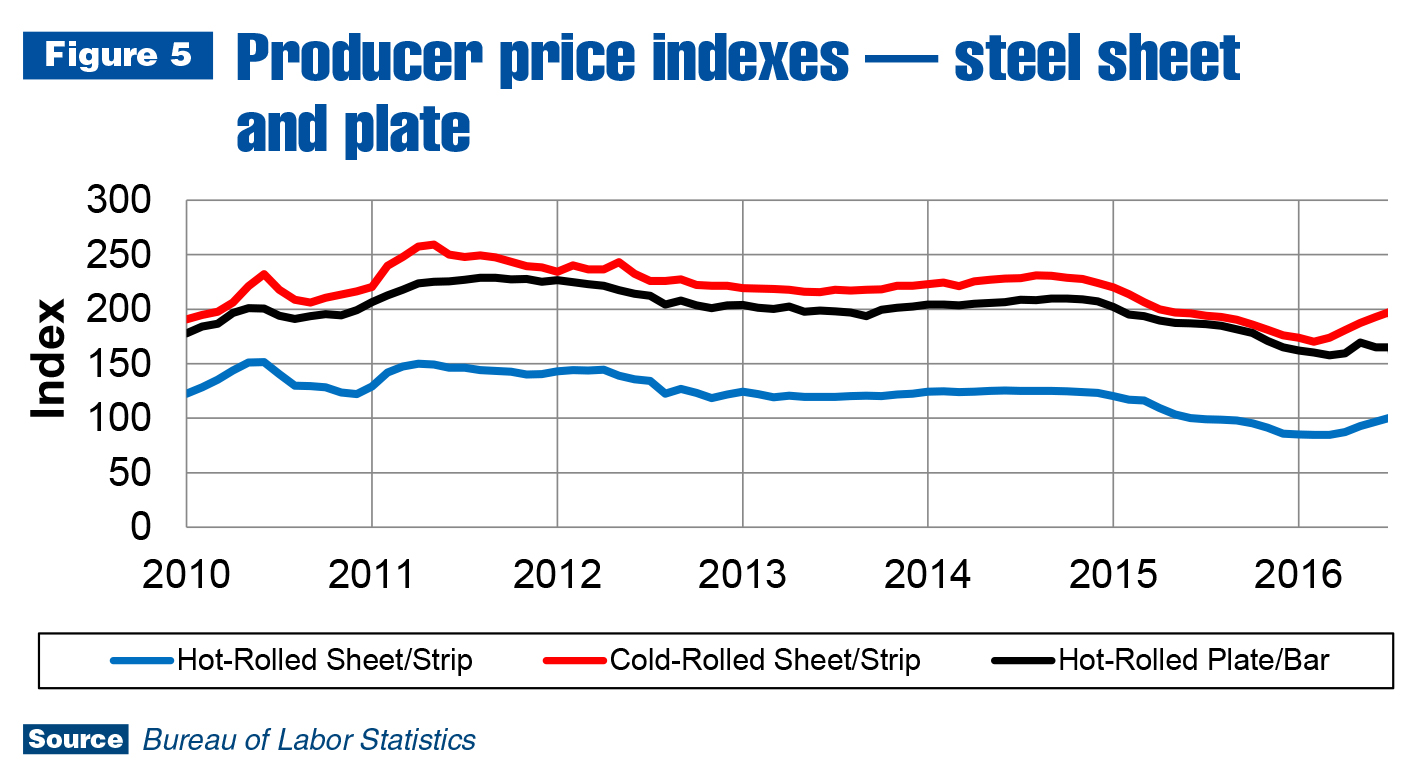
The aluminum market tells a different story, with sheet prices rising only 2.3 percent in the most recent quarter. U.S. prices remain down 3.0 percent for the year through July. As of the third quarter, there is a substantial supply surplus in the global market. Some analysts think current dynamics are similar to 1994 when producing countries agreed a memorandum of understanding was warranted to reduce inventory while supply was limited. A repeat is unlikely, though, and aluminum prices are expected to be stable through the second half of this year.
Leading indicators
Housing starts increased again in July, reaching 114,000 units, which is 6,800 units (6.0 percent) higher than July 2015. Through the month, there were 685,000 starts — 6.6 percent higher than 2015. So far, housing starts are behind forecast for 2016. In the June NABE Outlook, they were predicted to reach 1.21 million units this year. This was a slight downward revision from the March forecast of 1.24 million units.
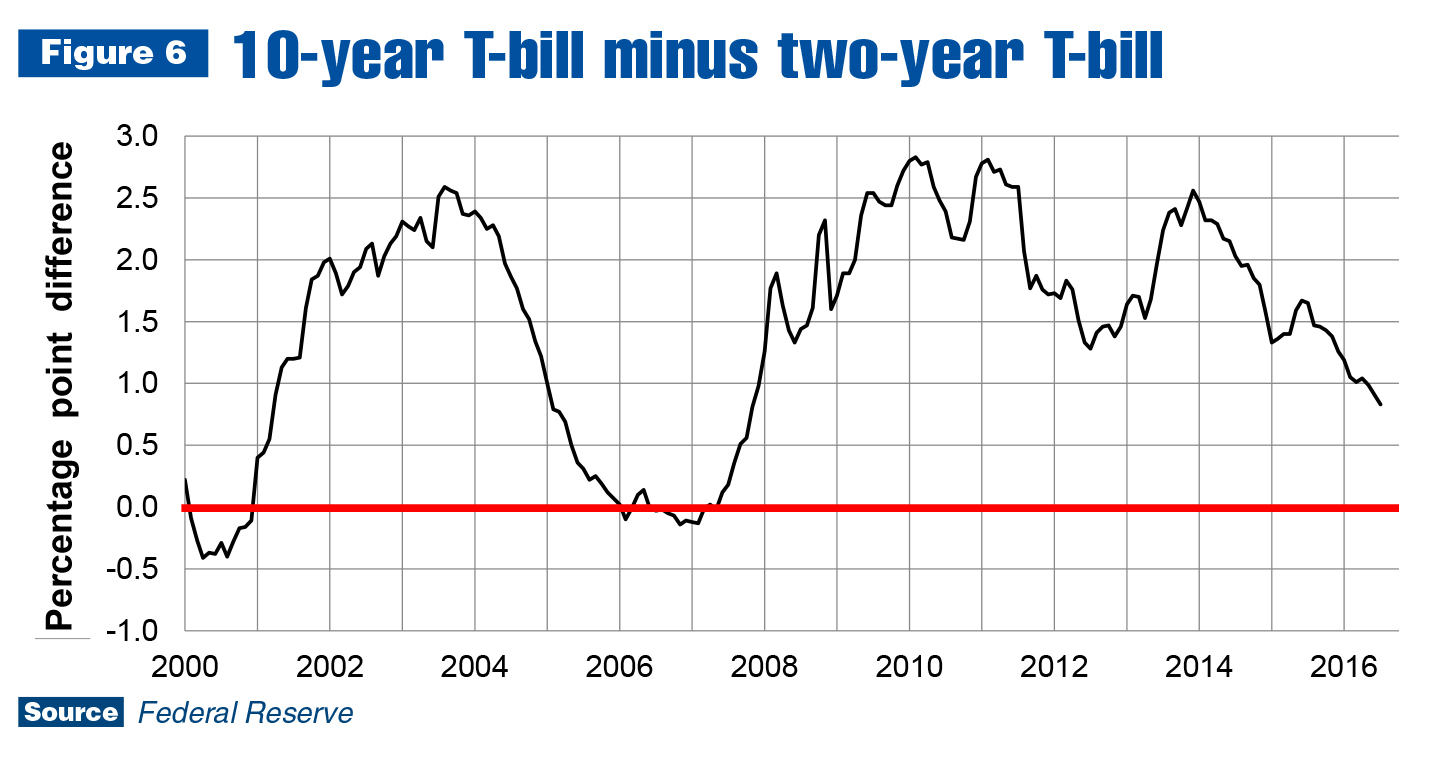
There is still time for housing starts to catch up, as August through October is part of the building season. The Federal Reserve could yet play a role by raising rates at the end of September. A rate increase, along with a signal that the Fed may continue boosting them periodically, would change consumer expectations and likely lead to an immediate jump in loan activity (for mortgages and other high-priced goods).
It would also affect the yield curve. As shown in Figure 6 (above right), the yield curve is trending down at a steep rate, which typically indicates financial market uncertainty. When it crosses the zero line, it signals the next recession could start about a year later. If the Fed raises rates in September, it would go a long way toward resolving some of the financial market concerns. As a result, there is a good chance the gap between 10-year and two-year Treasury bill rates will increase and send the yield curve in the other direction, which would stave off the start of the next recession.
As of September, the forecast for commercial trucks and equipment remains positive. The deceleration in the sales growth rate is expected to stabilize in the fourth quarter, according to the latest forecast update from IHS Automotive Division. The inventory correction ongoing in Class 8 (straight trucks and tractors) will likely run its course in the first half of 2017, and sales growth may resume in the second half of next year. The rest of the industry should continue growing slowly through this period of high capacity utilization and limited labor availability.
If you have any questions or comments about this article, contact Steve Latin-Kasper at 248-479-8193 or stevelk@ntea.com.
For additional resources and statistics to help your company plan for the future, login to ntea.com/marketdata. There, members can find information on U.S. truck sales and registrations; box-off truck chassis production and shipments data; commodity pricing; global commercial truck market data; leading industry indicators and forecasts; and more.