By Steve Latin-Kasper, NTEA Director of Market Data & Research
Meet our experts
This article was published in the July 2020 edition of NTEA News.
Key highlights
- The U.S. economy is expected to grow slowly in the third quarter before transitioning
to fast growth in the fourth.
- U.S. Class 1–7 commercial truck registrations are predicted to fall 20–25% this year.
- Steel prices may drop a bit as the global economy struggles with reopening, but will likely start rising by the end of the third quarter as U.S. manufacturing and construction sectors ramp up production.
Economy
Figure 1 indicates we’re experiencing a historic second quarter of 2020. National Association for Business Economics (NABE) forecast panel’s most recent forecast of second-quarter U.S. gross domestic product (GDP) called for a 26.5% decline. This was published at the beginning of May, and since then, more data has become available, which means the forecast will likely be revised downward when updated in June.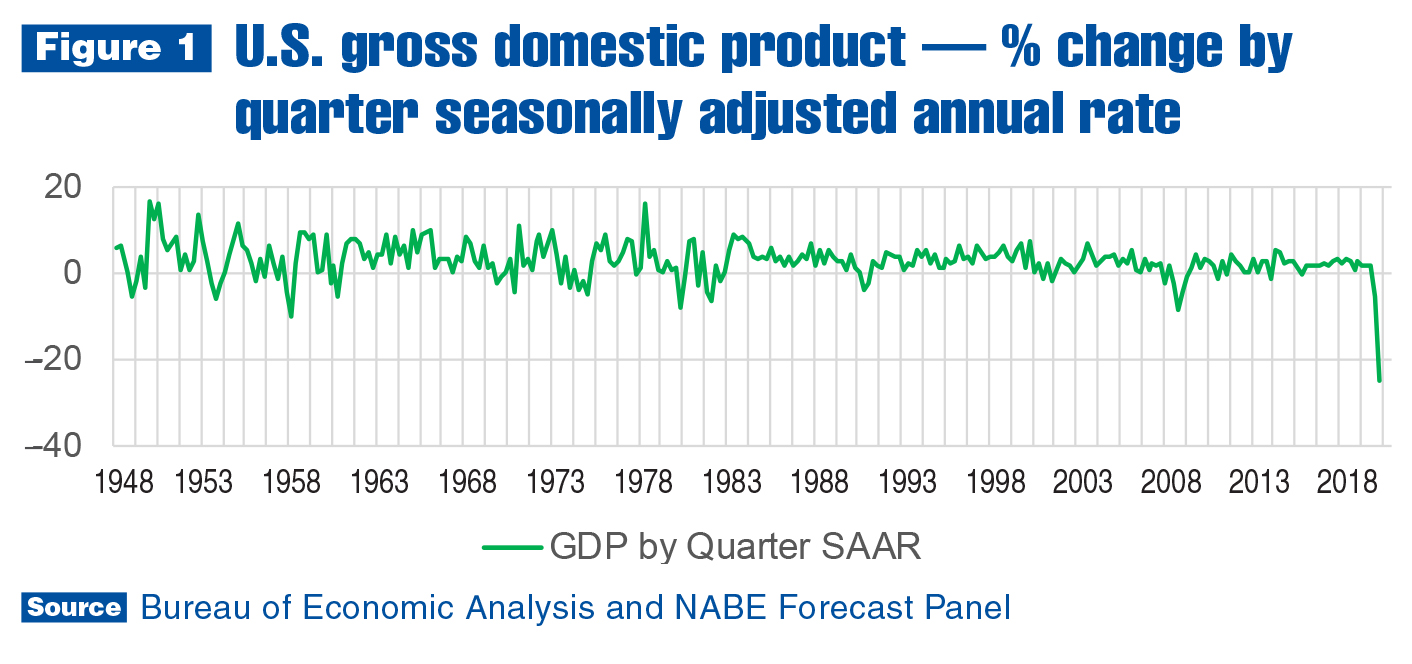
Current Federal Reserve projections indicate personal consumer expenditures (PCE) may fall more than 50% in the second quarter. This is worse than predicted in April and the primary reason downward GDP forecast revisions are probable, since PCE accounts for almost 70% of GDP. As of the first week of June, U.S. Conference Board is projecting a 45% second-quarter GDP decline. In addition to the steep drop in PCE, a more than 20% dip in capital expenditures and 35–40% decrease in exports (which add to GDP) are expected.
The eventual recovery from recession — and whether it will look like a V, U or W on a line graph — has been a key topic among economists. A V-shaped recovery is the most optimistic scenario. For this to occur, the economy would have to reach its cyclical trough in June, and increase in the third quarter just as fast as it declined in the second. It would require all of the people who lost jobs from March–May to be hired back in June and July, which is unlikely.
A U-shaped rebound will occur if the economy grows slowly but steadily in the second half of the year. In this scenario, labor market imbalances are resolved and PCE recovers to December 2019 levels by the end of 2020.
A W-shaped recovery would be the result of a V-shaped economic expansion being interrupted by a second wave of COVID-19 infections as a result of ending stay-at-home orders too soon. It could lead to a second round of stay-at-home orders and potentially cause recession to extend into 2021.
Most economists are predicting a U-shaped recovery. The U.S. economy is expected to grow slowly in the third quarter as consumer confidence rises and labor market imbalances are resolved, and then transition to faster growth in the fourth quarter. Consensus forecasts indicate that would lead to 5–10% lower 2020 U.S. GDP as compared to 2019.
Work truck industry
U.S./Mexico commercial truck chassis sales began first-quarter 2020 with a 13.8% decrease as compared to the same quarter last year. Sales were expected to decline in the first quarter (and for the year), but the onset of COVID-19 caused it to be deeper than expected. Sales fell in most cab-type segments and weight classes in the first quarter. They increased only in the low cab-over-engine segment, and Classes 4 and 5.
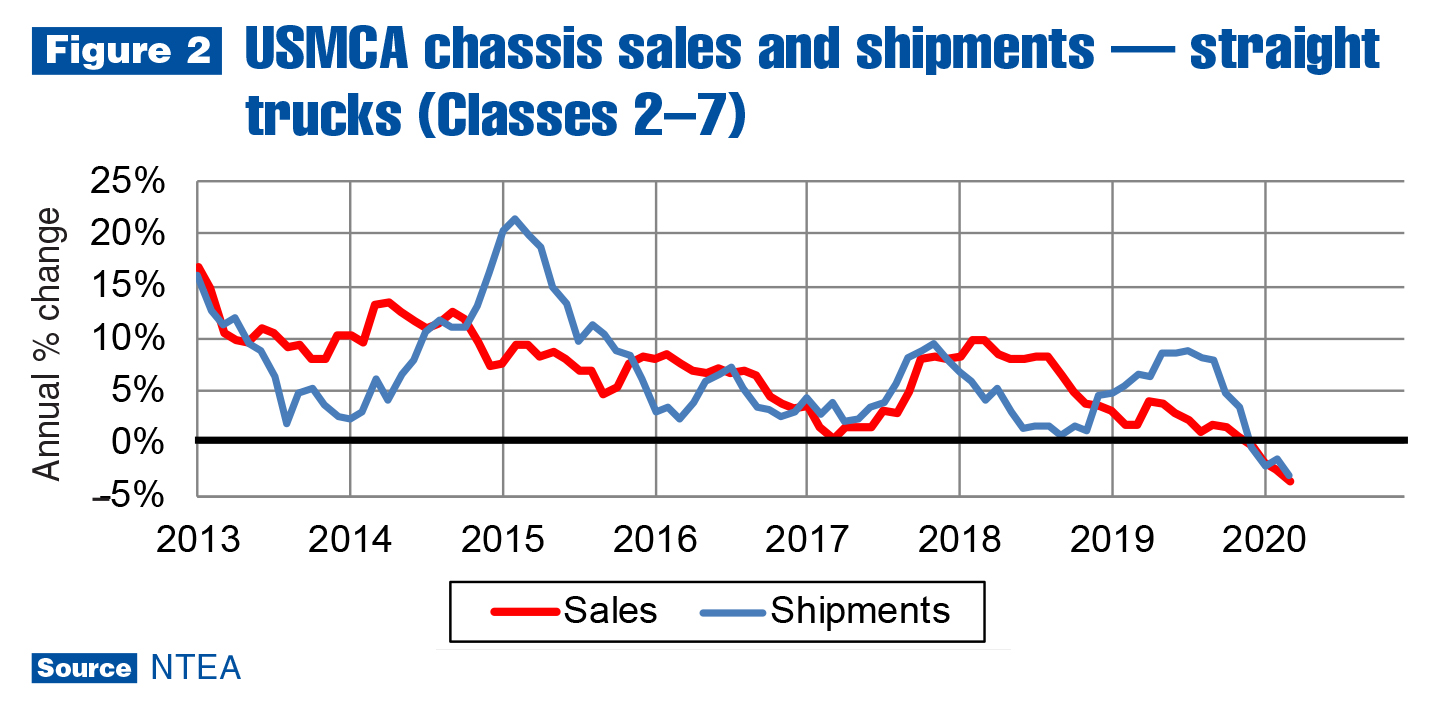
After decreasing 6.3% in the fourth quarter of 2019, Class 2–8 commercial truck chassis sales fell 13.8% in the first quarter of 2020 as compared to the same quarter last year. Figure 2 shows Class 2–7 sales and shipments also fell on an annual basis as of fourth-quarter 2019. The rate of decline accelerated for sales and shipments in the first quarter, and probably continued to do so in the second.
In the fourth quarter of 2019, Class 8 straight truck chassis sales grew just 1.3%, then decreased at a 12.3% rate in the first quarter of this year as compared to the first quarter of last. As of fourth-quarter 2019, OEM expectations were already low, and shipments fell 9.7%. They dropped another 21.4% in the first quarter, leading to a substantial decline in Class 8 inventory. Lead time remained near normal in the first quarter due to an extensive inventory build in 2019, but as a result of OEM plant shutdowns in April/May, lead time was stretched as of June.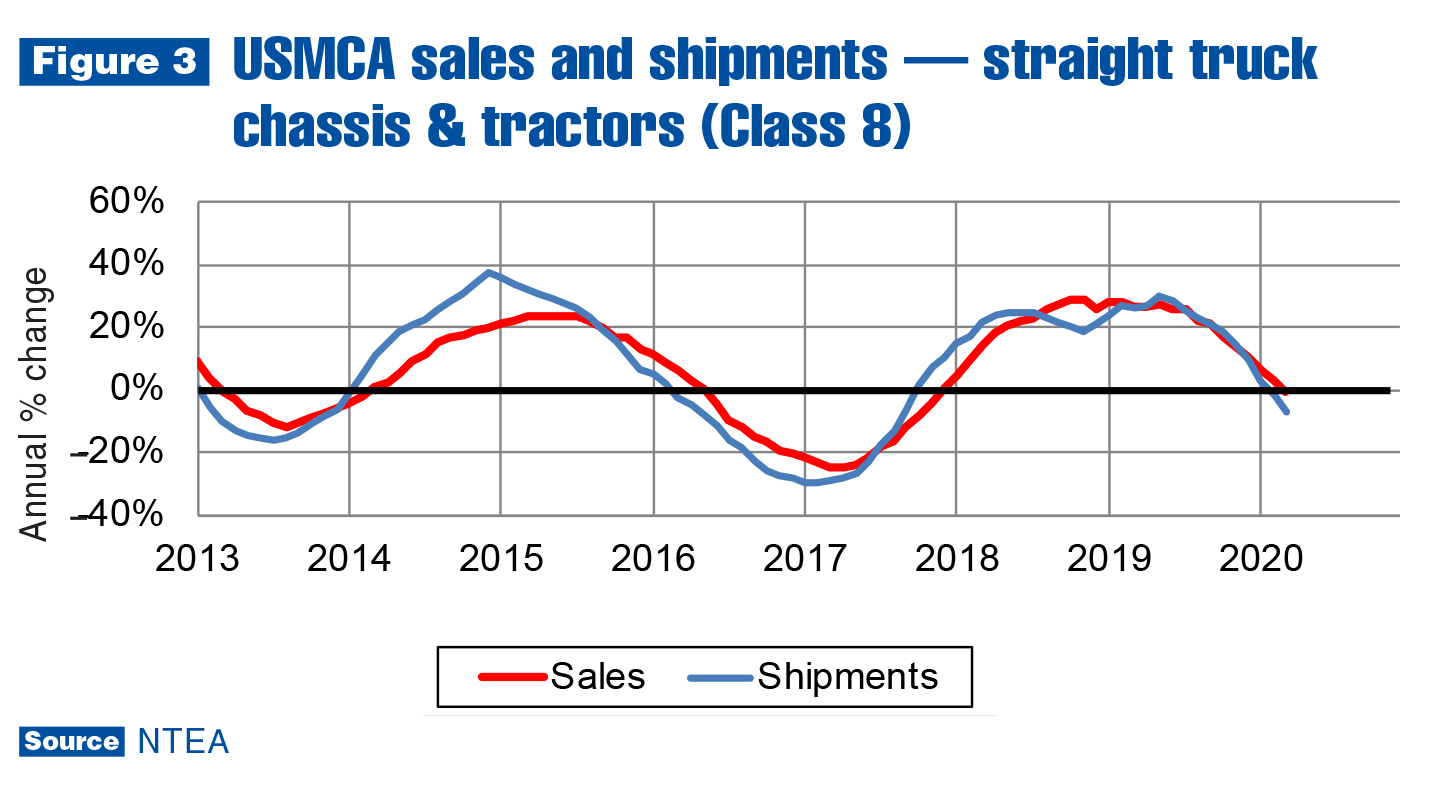
In the tractor segment of Class 8, sales fell 13.5% in the fourth quarter of 2019. The rate of decrease doubled to –27.4% in the first quarter of this year. OEM expectations began declining in third-quarter 2019, and shipments dropped at a 1.6% rate. The rate of decrease accelerated to 20.4% in the fourth quarter, and 33.9% in first-quarter 2020. As of March, tractor inventory was still building. Shipments were about 1,500 units greater than sales in the first quarter, in addition to a 7,000-unit inventory build in 2019. However, sales are still averaging about 13,000 units per month, so the 8,500-unit build the last 15 months was likely used up as a result of plant closures in April and May.
In total, North American commercial van (Classes 1–3) sales fell 11.7% in the first quarter of 2020 as compared to the same quarter last year. That number obscures substantial differences between roof-height segments. Standard roof-height sales registered a 25.4% sales decrease, while high roof-height increased 9.2%. Standard roof-height shipments declined about 31% in the first quarter, and high roof-height grew approximately 1%. Lead times stretched further in both segments.
In Canada, first-quarter 2020 sales decreased at a 21.1% rate as compared to the first quarter of 2019. Sales dropped in all cab type segments, and Class 5 was the only weight class to register a first-quarter increase.
Metals and energy prices
The price of hot-rolled steel sheet/strip fell 16.5% as compared to April 2019, and rose 1.6% as compared to January 2020. As illustrated in Figure 4, the price of hot-rolled steel sheet/strip started falling in the fourth quarter of 2018. It stabilized after reaching what appears to be a cyclical trough in January. It’s possible a trough has been reached (in same-month, previous-year terms) since China is the global economy’s largest consumer of steel, and its economy is accelerating again.
Recent changes in the price of hot-rolled steel plate/bars/shapes seem to support that idea. However, the price of cold-rolled steel sheet/strip dipped in April as compared to the previous month. This is likely due to COVID-19 impacts on the U.S. economy, the world’s second largest consumer of steel. Steel prices may fall a bit as the global economy struggles with reopening, but will probably start rising by the end of the third quarter as U.S. manufacturing and construction sectors ramp up production.
The story is slightly different in the aluminum products market. In sheet/strip and rods/bars/shapes markets, prices were down for the year and the most recent quarter. However, scrap prices have been rising since the fourth quarter. As scrap prices tend to be a leading indicator of product prices, sheet/strip and rods/bars/shapes prices are potentially near cyclical troughs.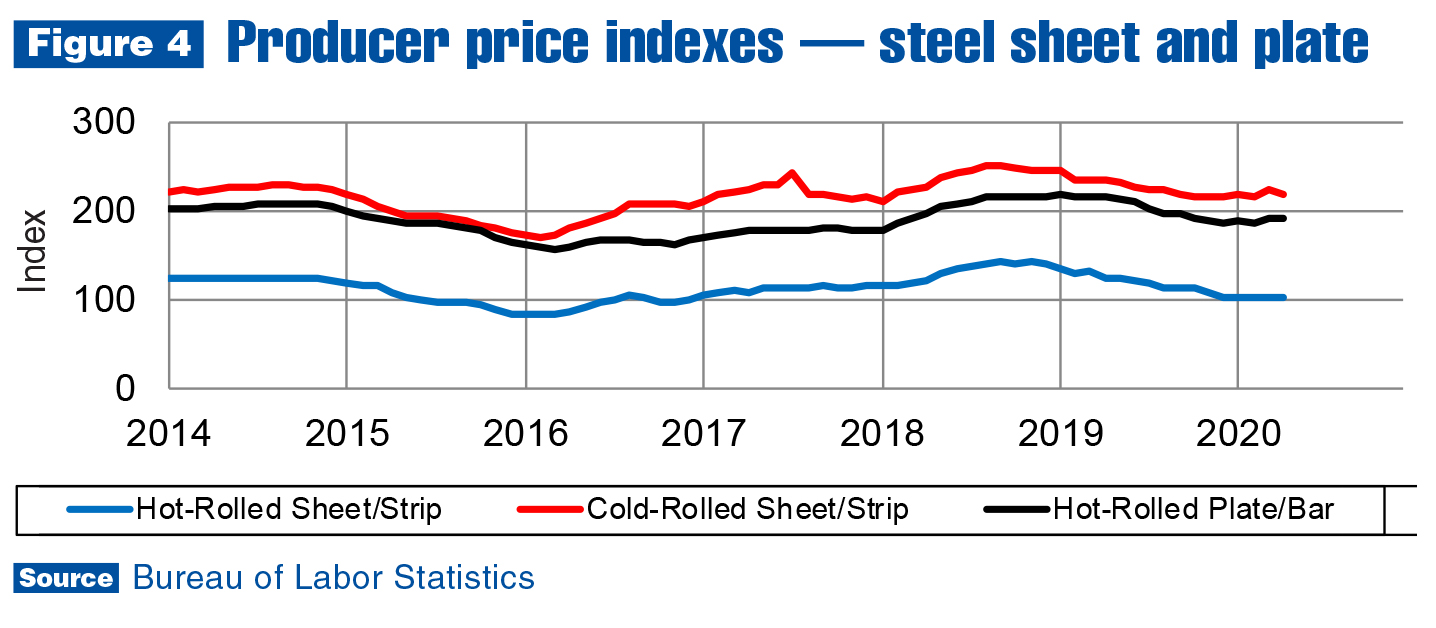 In the oil market, the WTI price per barrel crashed below zero on April 20, due to a sharp reduction in demand and extremely limited storage availability. As economies begin to reopen and lift restrictions, it’s anticipated prices will stabilize.
As of mid-May, it was clear demand was increasing again in Asia — most importantly, in China, as stay-at-home orders were lifted and people started driving again. As we approach the end of the second quarter, the price of oil seems to be growing again, at a steady pace. As of the first week of June, though, the U.S. price of diesel was still falling, although the rate of decline was decelerating.
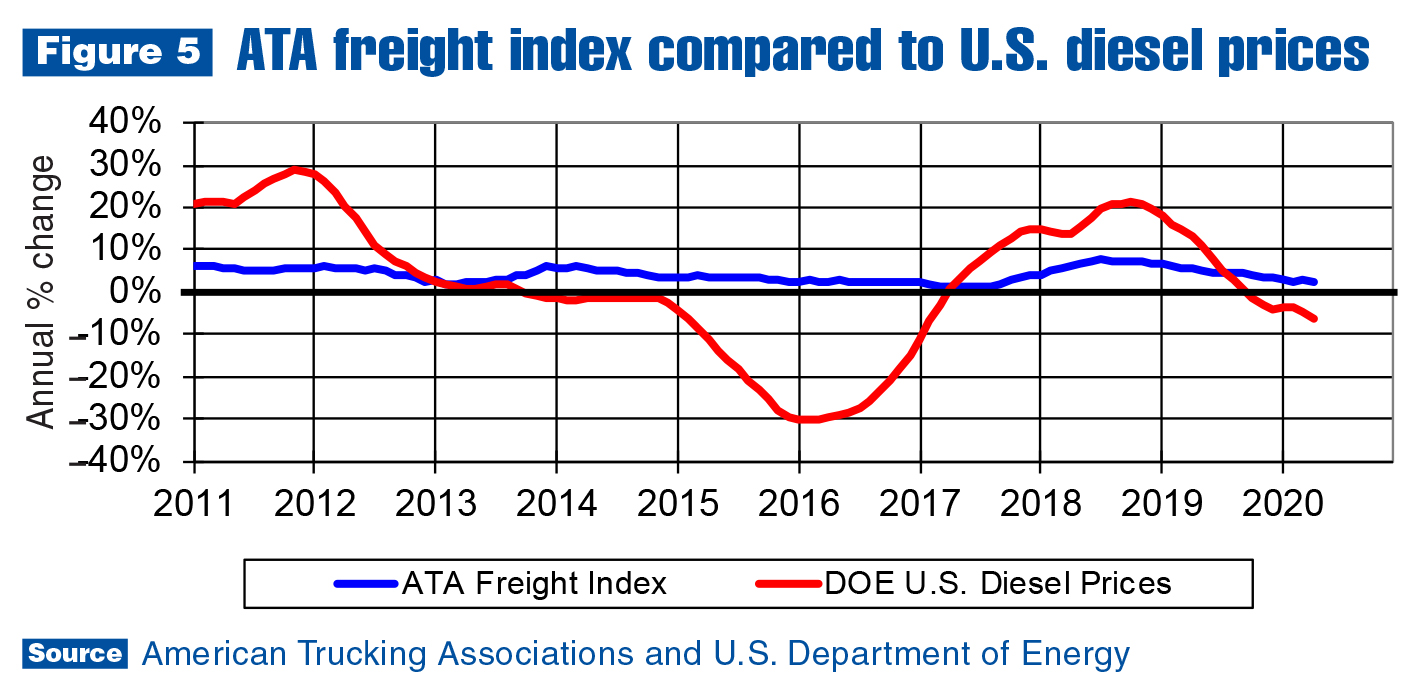
As shown in Figure 5, the price of diesel is growing more slowly than the amount of freight shipped. Normally, that would mean fleet managers have room in their budgets to spend more on things like trucks and truck equipment than they might have otherwise. However, these are not normal times. It is not known how fleet costs have been impacted by changes to workforce safety rules, or how changes to their labor forces are affecting the bottom line. The price of diesel will eventually increase along with oil prices, but the current growth rate difference between freight shipped and the price of diesel will likely remain advantageous for fleets through the third quarter.
Leading indicators
Housing starts grew faster than they had in more than a decade in January and February. The rate of growth for the first two months was 35%, but fell swiftly once the pandemic began impacting the economy in March. Starts rose just 6.9% in March, and fell 39% in April. What was expected to be a good year for housing starts, with high demand driven by family-forming millennials, is now predicted to be a down year relative to 2019.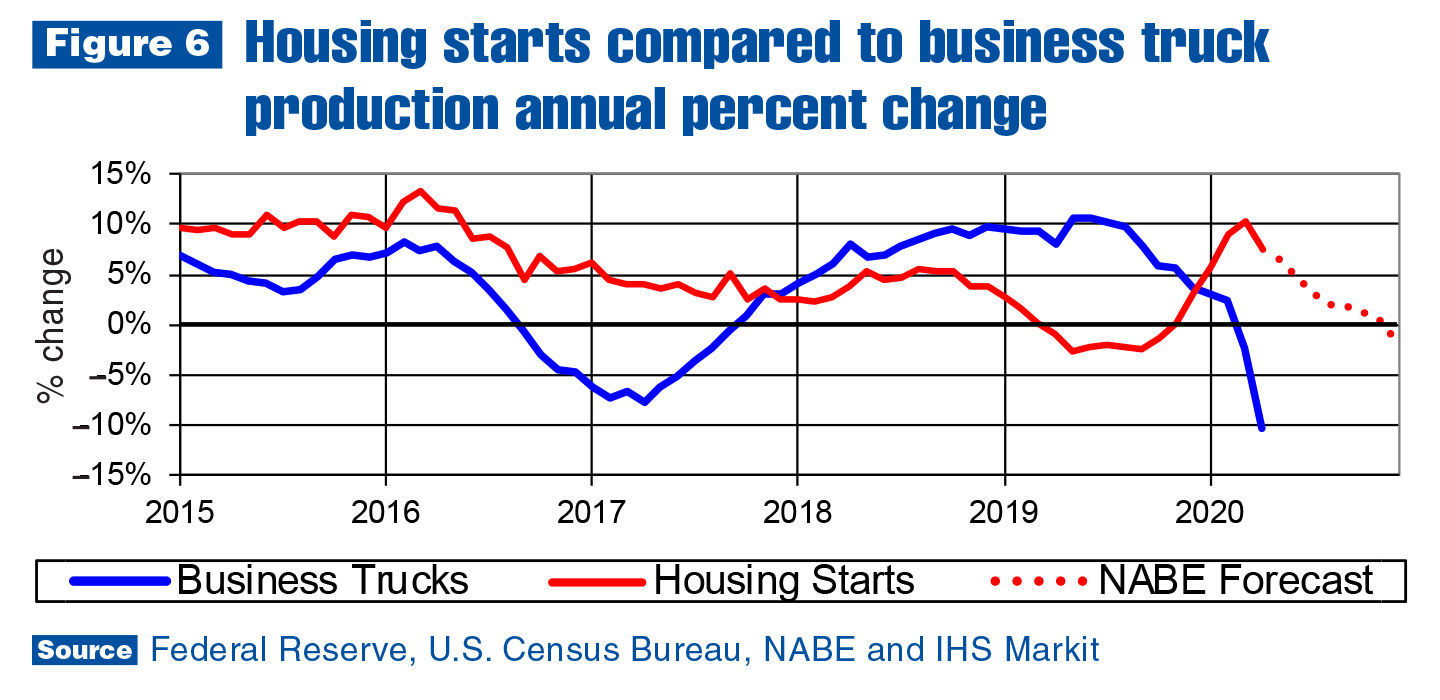
Looking beyond the downturn in housing starts, as shown in Figure 6, intersections of the business truck (Class 2–7) production and housing starts series predict the next turn in the business truck production cycle. The intersection that occurred in fourth-quarter 2018 led the next peak in the business truck production series by about 15 months.
Lead time varies from cycle to cycle, so it’s difficult to predict the next truck production cycle trough, but it’s likely imminent, as the two series intersected in November 2019. On average, the housing starts series provides a nine-month lead time of the next turn in the truck production cycle, which means the trough should occur about August 2020 (in line with IHS Markit’s current forecast).
The forecast could change drastically, though, from one month to the next. There is a fine line between the U- and W-shaped forecasts. Also, as of the beginning of June, there is no way to know how lifting stay-at-home orders will affect the COVID-19 infection rate.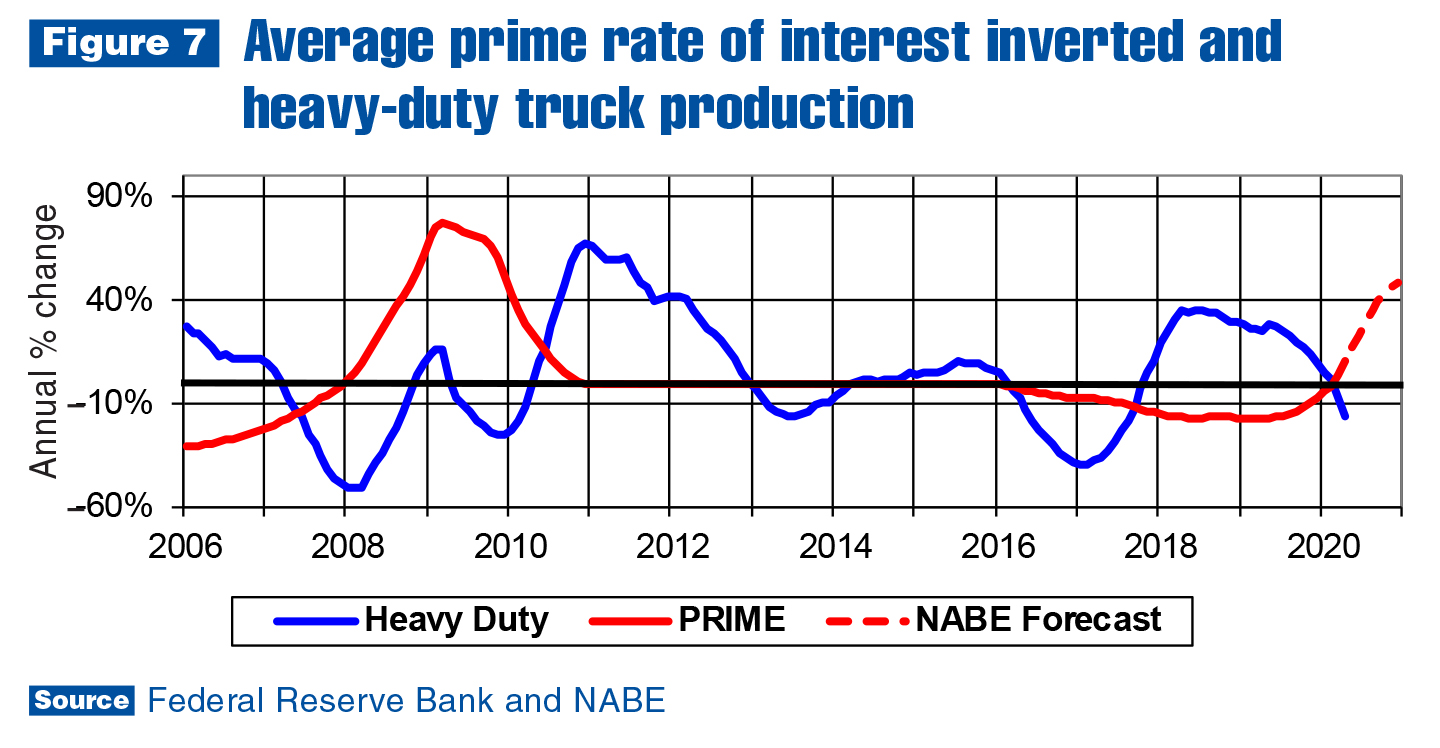
Interest rate data shown in Figure 7 is telling essentially the same story as housing starts, as of June. The intersections between average prime rate of interest inverted and the heavy-duty production cycle lead turns in the heavy-duty cycle (just as previously described for housing starts and business truck production).
Intersections in 2007 and the end of 2012 provided just six months of lead time prior to the next heavy-duty cycle trough. The intersection at the beginning of 2016 provided about 12 months of lead time. This time around, the intersection that occurred at the beginning of 2020 will likely provide six to nine months of lead time, which indicates heavy-duty production will trough sometime in the third quarter.
IHS Markit’s latest forecast predicts U.S. Class 1–7 commercial truck registrations will fall 20–25% this year. Class 8 registrations are projected to decrease about 40%. However, just as the pandemic changed the timing of the work truck industry recession, it altered expectations for the next expansion. The previous forecast called for commercial truck registrations to continue declining in 2021, but commercial truck registrations are now expected to increase about 10% next year.
For more industry market data, visit ntea.com/marketdata.
Upcoming webinar
Work truck industry market activity — A mid-year update
Wednesday, July 22, 2020, 11:15 a.m.–noon EDT
Many industry companies have been dealing with large disruptions from COVID-19 and are starting to build tactical plans for the coming year. Understanding established market trends and anticipated developments is critical. Join NTEA's staff economist for valuable insight on the year ahead. Presented by Steve Latin-Kasper, director of market data and research, NTEA. Register