By Steve Latin-Kasper, NTEA director of market data & research
This article was published in the September 2019 edition of NTEA News.
Key highlights
- North American truck body and equipment dollar sales increased 15.9% in 2018.
- Truck chassis and body prices were flat or trending down in the second quarter of 2019.
- Steel and aluminum prices are expected to be stable in the second half of this year.

NTEA’s newly released Annual Manufacturers’ Shipments Survey (AMSS) Report (20th edition) indicates North American truck body and equipment dollar sales increased 15.9% in 2018. Almost all work truck industry segments grew last year — some substantially faster than average. For example, telescopic crane and dry freight van body dollar sales increased more than 30%.
For most product lines, unit sales growth was not as high as dollar. While this is normally the case, 2018 was exceptional. Totals for bodies sold separately were representative of industry average. Dollar sales rose 20.4% and unit sales climbed 9.8%. Inflation throughout the North American economy was only 2% last year — not the driving force behind a 10 percentage-point gap between dollar and unit sales. Tariffs are the reason rate of growth was so much higher in dollar terms.
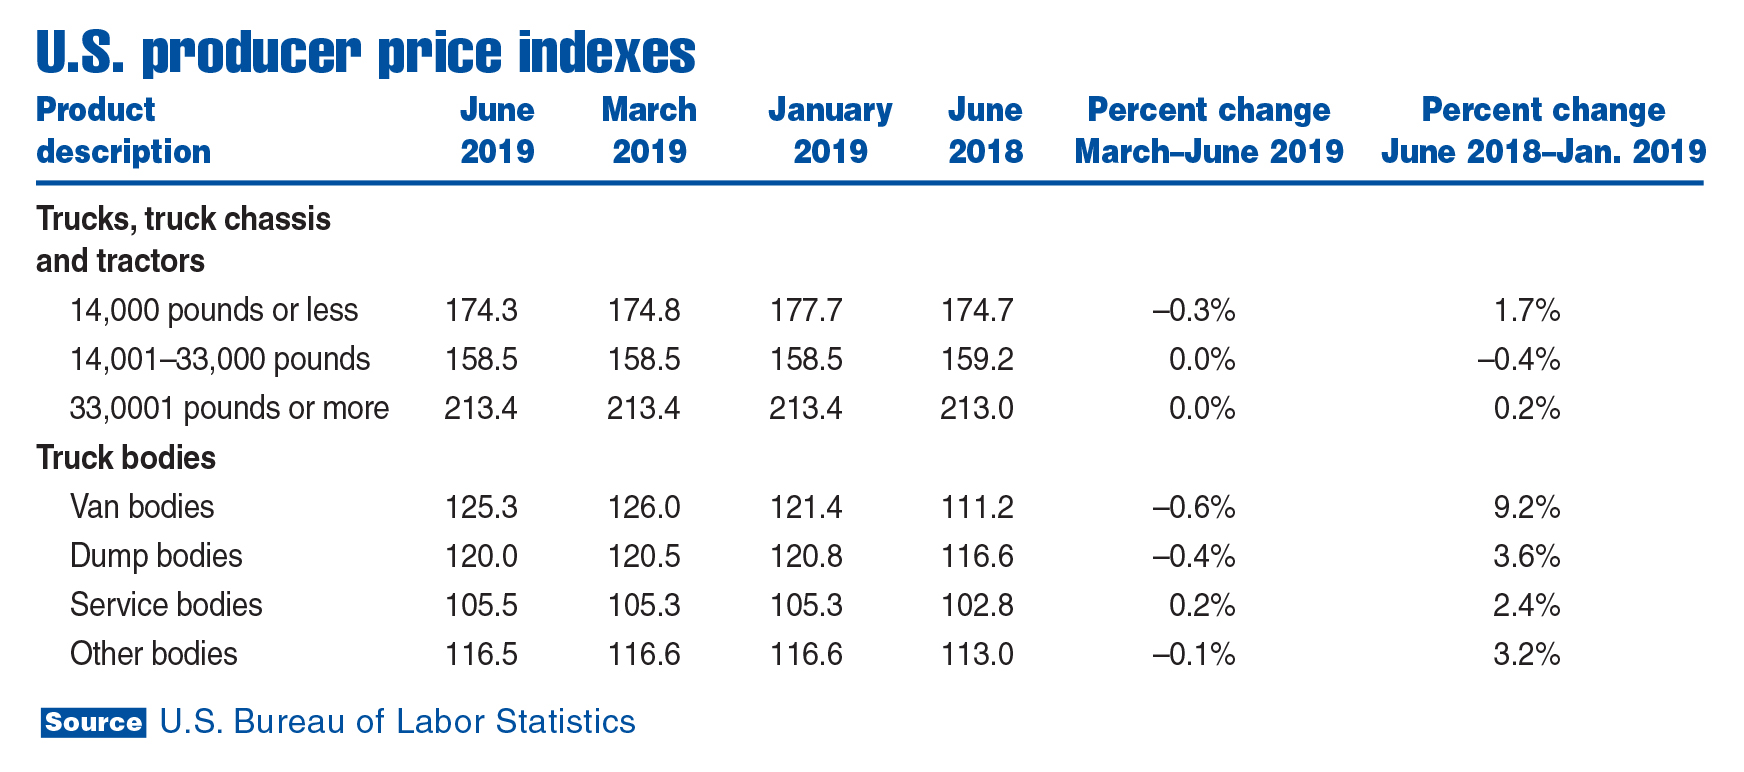
The chart above shows the impact of tariffs on prices in the second half of 2018. (Note, the definition of second half was stretched to January 2019 to present this data, as many companies waited until the beginning of the year to raise prices.) Clearly, tariffs did not affect all industry segments equally. Substantial truck body price increases, relative to the consumer price index, were expected. The surprise was increases in steel and aluminum tariffs had little effect on chassis. OEMs essentially weathered the tariff storm with no price hikes in Classes 4–8, according to Bureau of Labor Statistics.
Related: Outlook leading into 2020
The chart indicates truck chassis and body prices were flat or trending down in the second quarter of 2019. This is primarily the result of steel and aluminum tariffs being lifted on Canada and Mexico in May. In the second half of this year, steel and aluminum prices are expected to be relatively stable, with minimal impact on work truck industry pricing. This means the gap between growth rates in unit and dollar terms will likely be in line with the consumer price index in 2020.
It’s interesting to compare the 2018 AMSS truck bodies sold separately total to the monthly chassis shipments data published by NTEA. The total number of truck bodies plus complete vehicles produced on purchased chassis reported by participants in this year’s survey was about 243,000 units. Total Class 2–8 chassis reported by OEMs for 2018 was about 473,000 — meaning AMSS included about 51% of the bodies mounted on those chassis. When the estimate was made for dump bodies, it increased total body count to 311,568 units (as published in the report), or 66% of the chassis total.
Survey participation benefits
AMSS, like all NTEA surveys, is voluntary. It’s the only annual survey conducted in North America intended to generate data defining market size and rate of growth. As many companies seek this information, the best way to get the data is to participate. In addition, more data means a more accurate portrayal of industry activity in the resulting report.
This resource can help you
- Better approximate market size
- Learn how much the market grew
- Determine whether or not your company kept pace
- Compare your business to the overall industry
AMSS participation won’t eliminate the need for market research, but it can decrease staff time necessary to generate market size estimates needed for annual planning. Helping member companies further their profitability is part of NTEA’s mission — and conducting surveys enabling participants to potentially minimize costs associated with annual planning is one of the ways this can be accomplished.
Related: Monthly market data updates
AMSS is mailed to all NTEA manufacturer member companies each February. If you have any questions on participation or how NTEA maintains confidentiality of individual company data, email me at stevelk@ntea.com.
Visit ntea.com/amss to learn more and order the newest report.