By Steve Latin-Kasper, NTEA Director of Market Data & Research
This article was published in the August 2018 edition of NTEA News.
Key highlights
- Truck equipment industry shipments increased 2.9 percent in 2017.
- Consistent with historic results, there is significant variation in product line growth rates.
- AMSS enables companies to effectively gauge market size and build strategic plans.
NTEA’s newly released Annual Manufacturers’ Shipments Survey (AMSS) Report (19th edition) indicated North American shipments of truck equipment, complete vehicles produced on purchased chassis and trailers increased at a 2.9 percent rate in 2017. This was an improvement from 0.3 percent growth in 2016. NTEA compiled and analyzed aggregate results for the membership based on feedback from 100 participants. Report content provides directional guidance to help companies assess performance.
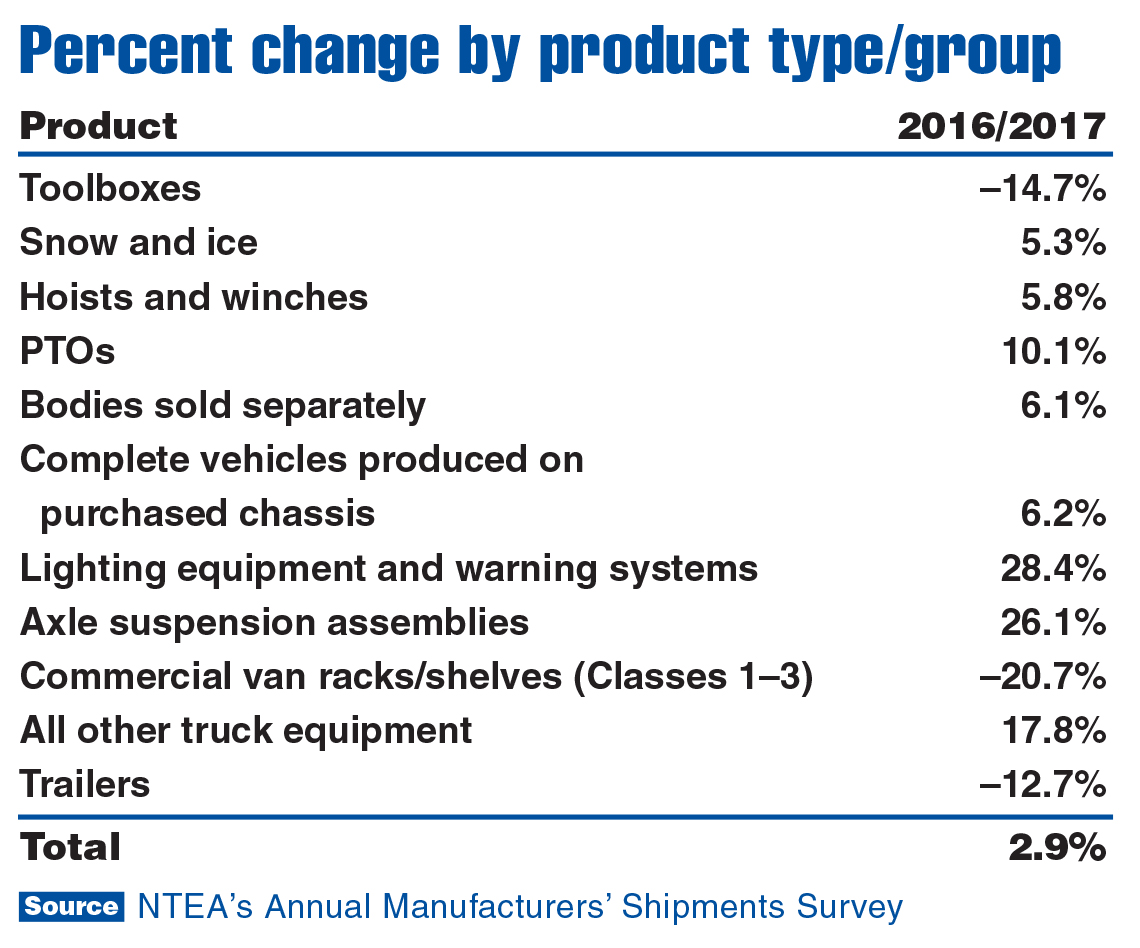
As shown in the chart above, not all industry segments grew at the same rate in terms of dollar value shipped. Most increased faster than the 2.9 percent average, but the rate was skewed downward by declines in the toolbox, commercial van racks/shelves and trailer segments.
For most product lines in the survey, the rate of change can also be calculated in unit terms — providing a measure of the amount dollar values were influenced by inflation. In addition, unit values make it easier to compare AMSS results to the monthly data generated by NTEA’s OEM Statistics Program, which measures the number of truck/bus chassis sold and shipped in the North American market.
AMSS participants reported a total of $5.8 billion dollars of North American shipments. Industry shipments of the core product lines in AMSS (bodies sold separately, complete vehicles produced on purchased chassis and truck equipment) are estimated to be roughly $24.5 billion. This means the 2017 survey includes about 25 percent of what the total would be if all NTEA manufacturer members contributed data.
Why participate?
This resource can help you:
- Better approximate market size
- Learn how much the market grew
- Determine whether or not your company kept pace
- Compare your business to the overall industry
AMSS is the only source of market information for many of the products included in the survey. It is the only source that includes both unit and dollar values, and body type calculations
by gross vehicle weight rating percentages. The only other data source with extensive market segment detail is Census of Manufactures, which is conducted once every five years — not annually, like AMSS.
Most companies may only require a few minutes to complete the survey. All that’s needed is to input data they have already collected for their own purposes. For some larger businesses, it takes longer, but in 18 years of conducting the survey, the longest completion time shared by a participant was three hours.
Participating in AMSS saves time. Results are used for market planning purposes — and without this readily available data, effort will likely be spent tracking down information from other sources each year.
Due to lower participation in some product lines, NTEA provides market segment estimates to add value to the report. This was done for plows and spreaders in 2016 and this year. Also, approximations were made for truck and trailer liftgates for the first time. If participation remains limited in the dump body segment, an estimate will be provided in the 2018 report next year.
Learn more
Visit ntea.com/amss for more details, and contact NTEA’s team with any questions (info@ntea.com or 800-441-6832). For more industry market data, visit ntea.com/marketdata.