By Steve Latin-Kasper, NTEA Director of Market Data & Research
This article was published in the April 2017 edition of NTEA News.
U.S./Mexico commercial truck chassis sales rose 0.5 percent in 2016 as compared to 2015. After growing in the first and second quarters, sales fell in the third and fourth. The second-half sales slide was primarily due to a large decline in private inventory investment and slow overall U.S. economic growth.
U.S. real gross domestic product (GDP) increased at a 1.9 percent annual rate in the fourth quarter of 2016, according to the second estimate released by Bureau of Economic Analysis in February. The GDP jump in the fourth quarter reflected positive contributions from personal consumption expenditures, private inventory investment, residential fixed investment, nonresidential fixed investment, and state and local government spending. Increases were partly offset by drops in exports and federal government spending.
Deceleration from 3.5 percent growth in the third quarter was mainly the result of declines in exports and federal government spending. This was somewhat counterbalanced by increases in residential fixed investment, private inventory investment, and state and local government spending.
While the fourth-quarter GDP report is not likely considered good news, it could have been worse. The U.S. economy continued growing in 2016, and consensus forecasts predict even faster growth in 2017. The good news for the work truck industry is that residential construction, inventory investment, and state and local government spending gained momentum leading into the new year.
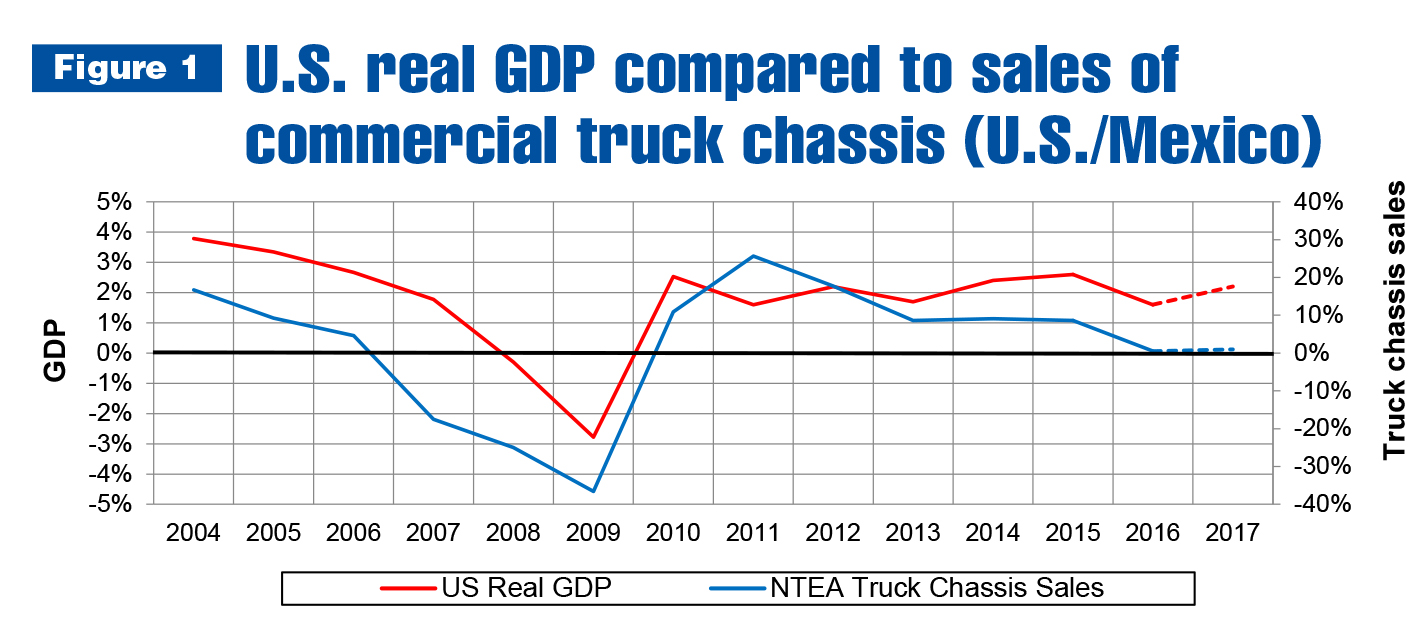
As shown in Figure 1, GDP and commercial truck chassis sales tend to move in the same direction. Typically, chassis sales grow faster than GDP, and fall quicker during recessions. However, current expectations indicate the relationship between GDP and chassis sales won’t be typical this year. IHS’s forecast for U.S. commercial truck chassis sales calls for growth of only 1 percent, which is less than Bloomberg’s 2.2 percent projection for GDP.
Another key relationship involves unemployment and inflation. Historically, when the unemployment rate falls, the inflation rate increases. Between 2013 and 2016, that connection deteriorated. The unemployment rate fell from 7.4 percent in 2013 to 4.9 percent in 2016, while inflation went from 1.5 percent to 1.3 percent. In fact, the rate of inflation fell to 0.1 percent in 2015.
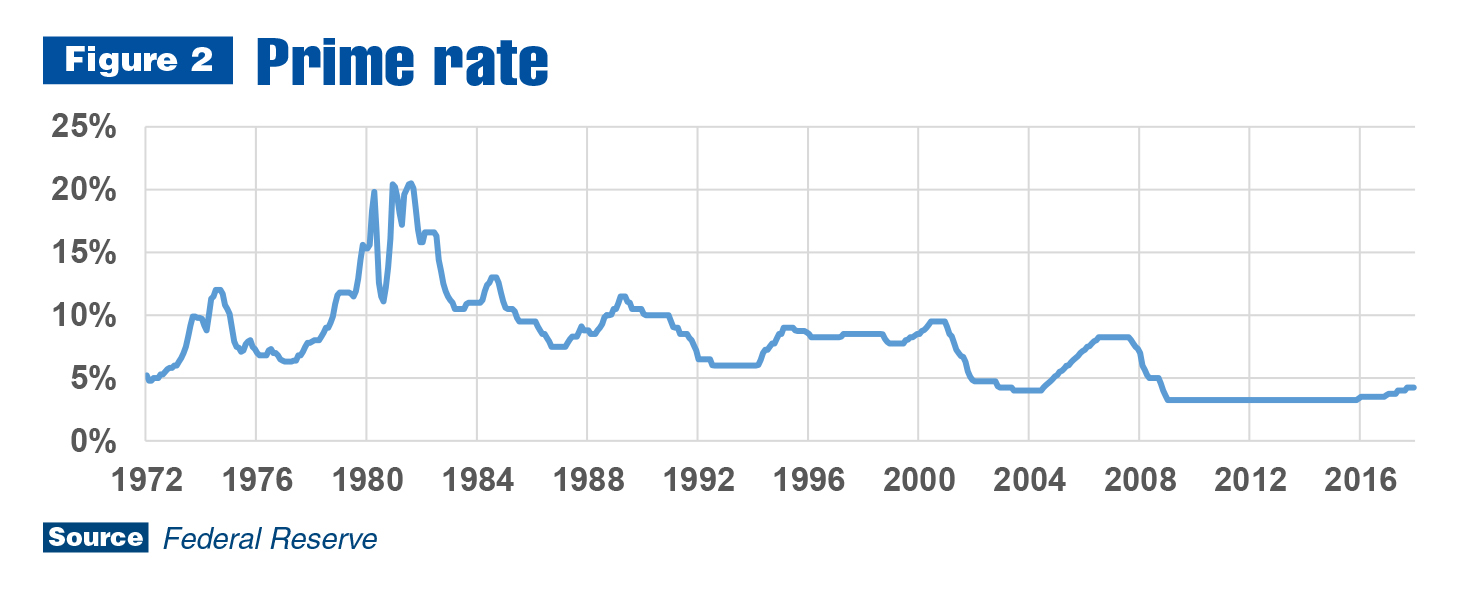
This relationship is expected to normalize in 2017. The National Association for Business Economics (NABE) Outlook predicts unemployment will fall to 4.7 percent while inflation rises to 2.3 percent. Inflation trended up throughout 2016, moving from 1.1 percent in the first quarter to 1.5 percent in the fourth. It reached 2.1 percent in December and 2.5 percent in January 2017. If it continues increasing in the first half of 2017, the Federal Reserve will likely raise interest rates higher and faster than expected (see Figure 2). This will be important for industry companies to monitor. If inflation rises faster than expected this year, business plans may need to be adjusted to account for effects on bills of materials.
Work truck industry
Last year, the industry experienced many ups and downs. In total, U.S./Mexico commercial truck chassis sales rose 0.5 percent. The year started well with 10.3 percent first-quarter growth. But the macroeconomic inventory adjustment that started in the second half of 2015 began affecting chassis sales in the second quarter of 2016, in which they grew only 1.5 percent. They fell 5.8 percent in the third quarter, and the rate of decline improved slightly to –3.1 percent in the fourth.
For the year, all nonconventional chassis sales rose. Strip sales climbed 2.5 percent in 2016, but the growth rate decelerated throughout the year. Sales dropped almost 15 percent in the fourth quarter. Cutaway sales increased 9.8 percent as a result of 30 percent growth in the fourth quarter. Low cab-over-engine sales grew 10 percent because of 20 percent growth rates in the first and fourth quarters that outweighed slow growth in the second and third quarters. End-of-year results looked good, but there was substantial volatility throughout those 12 months.
In total, nonconventional chassis sales increased just enough to balance a 3.8 percent decline in conventional cab chassis sales in 2016. The year started well for the conventional segment, which registered 10.1 percent growth in the first quarter, but the rate quickly decelerated to 1.5 percent in the second quarter. Sales fell at a 12.7 percent rate in the third quarter, and improved slightly in the fourth to –11.9 percent.
In the complete vehicle segment, a similar growth pattern emerged for commercial van sales in 2016. The year began with a 14.6 percent increase in the first quarter, but the rate of growth dropped to 3.6 percent in the second. Third-quarter growth was negative — although, as was true for most other market sectors, fourth-quarter sales were not as negative as the third. Tractor sales growth was in the red in all quarters of 2016, but there was improvement in the fourth quarter.
In sum, the industry declined in the second and third quarters of 2016, but the deceleration halted in the fourth. Anecdotal evidence indicates as of the first quarter of 2017, quote activity and orders are rising. Sales, though, had a slow start. According to WardsAuto.com, the Class 2–8 total was down from January 2016. Decreases in Classes 5, 7 and 8 outweighed gains in Classes 3, 4 and 6. The variance between segments was expected.
Commercial truck chassis sales predictions remain marginally positive for this year. As of December 2016, the IHS Markit forecast called for 1 percent growth — a downward revision from the 4 percent forecast published in July. NTEA’s market analysis concluded sales will rise at least 2 percent in 2017, with the caveat that faster-than-expected U.S. GDP growth will boost commercial truck sales as well.
The weak forecast is based on the fact that growth limits remain. Labor may tighten even more this year. Capacity utilization remains high, and some companies have responded by building new plants. There is also a fair amount of ongoing consolidation which may lead to increased productivity. It is more likely the current forecast for 2017 will turn out to be too low than too high. However, a 5 percent increase in sales this year feels like a stretch goal as of the first quarter.
Metals and energy prices
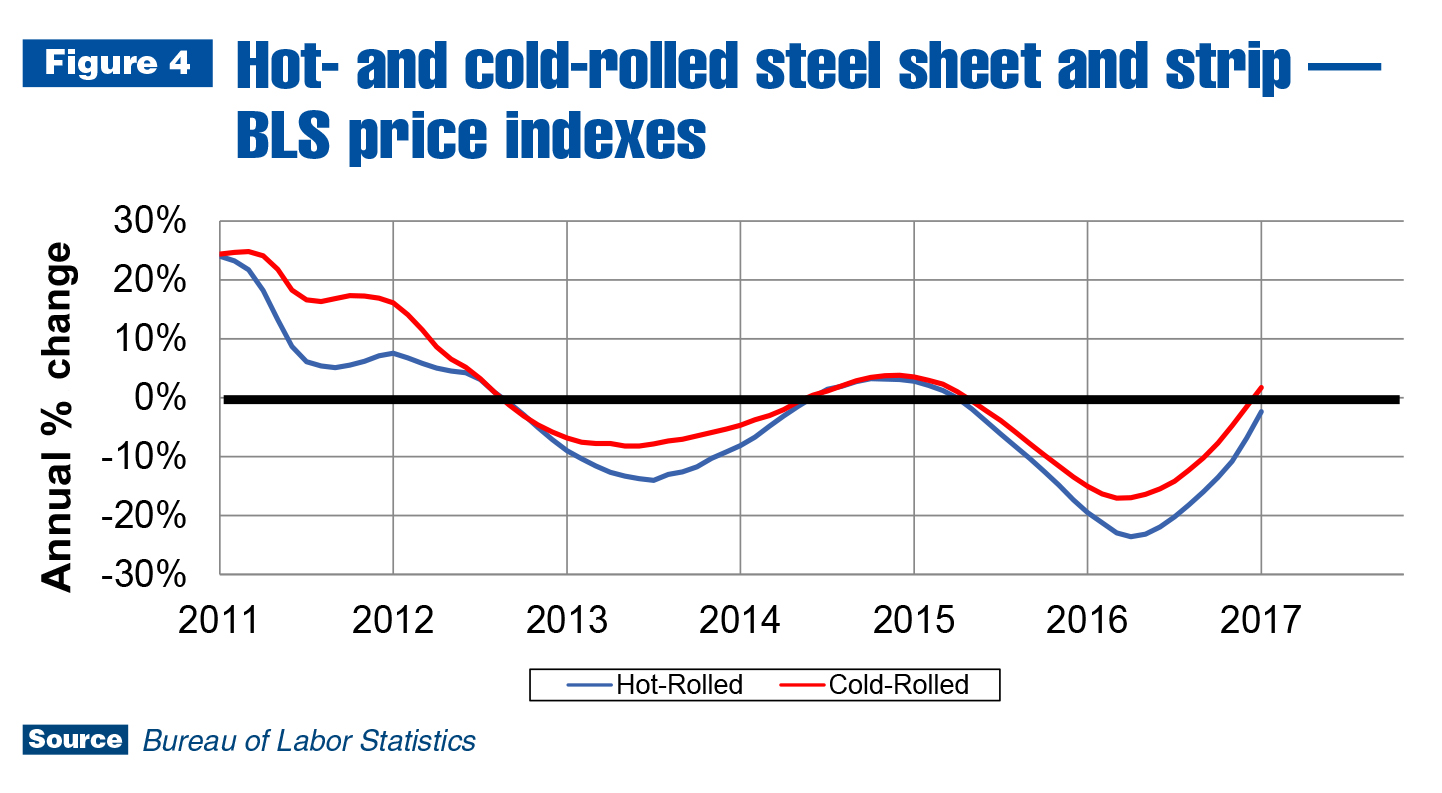
As shown in Figure 4, hot- and cold-rolled steel sheet/strip prices rose in the second half of 2014 in seasonally adjusted annual rate (SAAR) terms, and declined through most of 2015 and all of 2016. On current trend, steel sheet/strip, as well as steel plates/bars/shapes prices, should increase in 2017. Consistently rising steel prices is even more likely if the current administration’s plans for federal government investment in transportation infrastructure are approved by Congress in the first half of the year.
Aluminum sheet prices climbed briefly in 2015, and dropped substantially in 2016. As of the fourth quarter, though, they were trending up. Aluminum prices seem to be cycling about three to six months behind steel prices. On current trend, they may start rising (in SAAR terms) in the second quarter of 2017. On a month-to-month basis, aluminum and steel prices are already increasing.
When the world’s largest economy grows, however slowly, upward pressure is eventually put on commodities prices. That is just as true in the oil market as in metals. The global (Brent spot) price of oil has been rising steadily for four consecutive quarters, and the first quarter of 2017 will mark the fifth. This is also occurring with diesel fuel in the U.S. Prices aren’t likely to fall this year, even as drilling rigs are turned back on. The nation’s oil companies learned their lesson in 2015, and probably won’t let supply run as far ahead of demand again. NABE’s December 2016 Outlook predicted the Brent spot price would be $52 in December 2017, and it’s fairly safe to assume the March Outlook oil price prediction will be higher.
Leading indicators
Figure 5 shows housing starts are expected to continue increasing in 2017. They rose 5.6 percent last year to 1.17 million units. NABE’s current forecast is that starts will reach 1.3 million units in 2017. This would be an almost 11 percent increase, and because of the growth limits mentioned previously, it may be a bit optimistic.
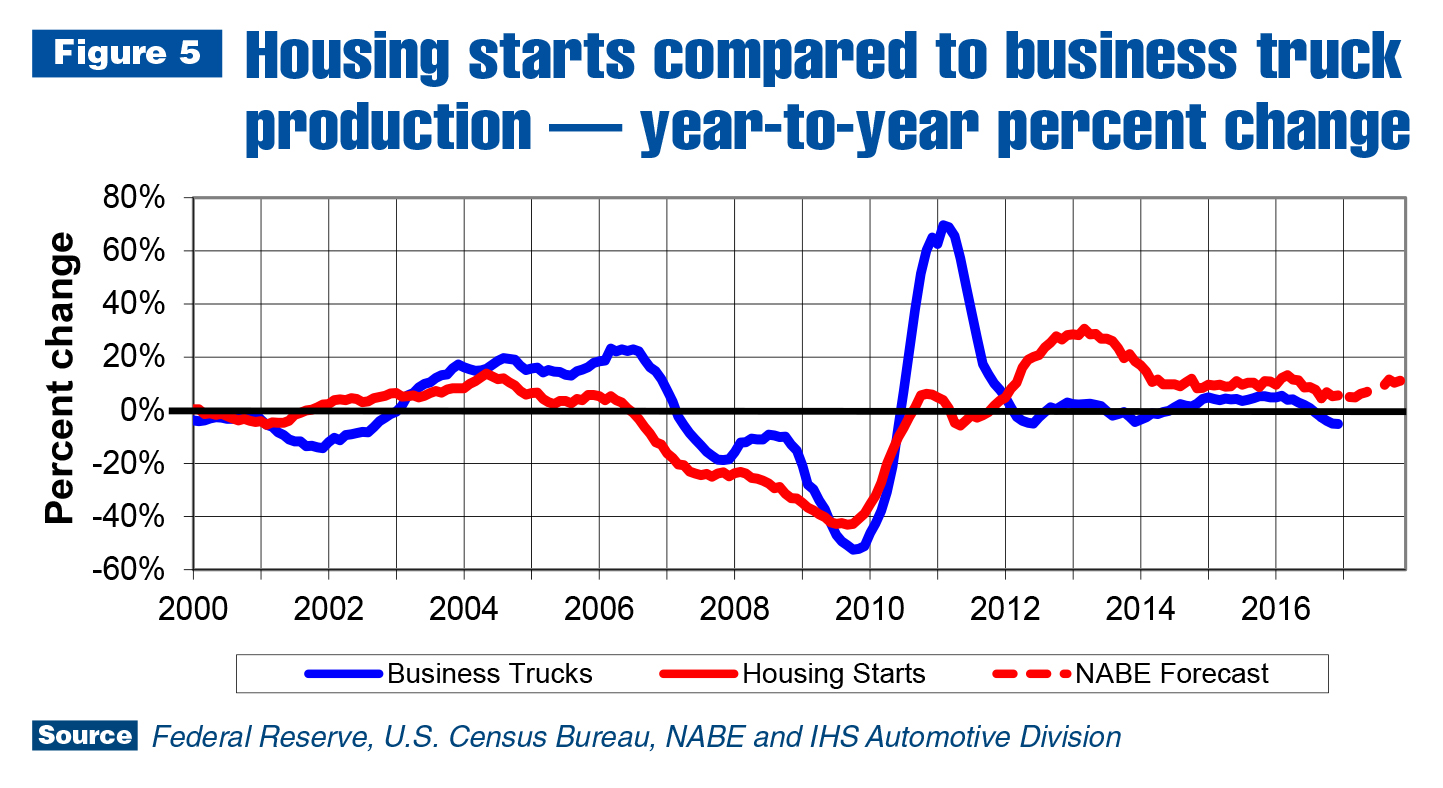
Demographics that drive the forecast are straightforward. Millennials are moving out, and the leading edge of the generation is starting to form families. This is driving up prices of existing houses and apartment rents. If incomes don’t increase at a comparable rate, some of the millennials who moved out may have to move back in. An issue, though, is that the construction sector is having the same difficulty finding qualified labor as most other U.S. industries. They can’t build more houses this year than last with less labor.
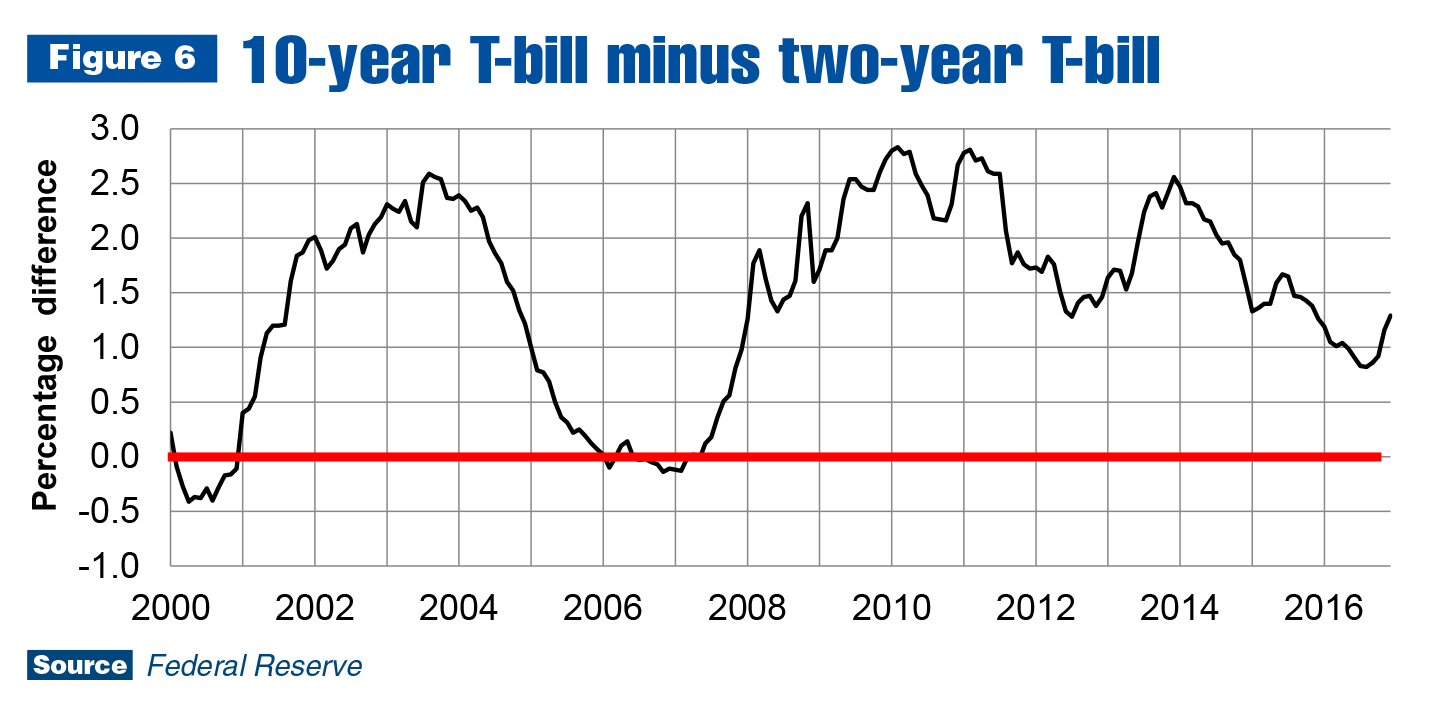
There are still some economists predicting recession this year or next, but it remains highly unlikely. As illustrated in Figure 6, the gap between two-year constant maturity Treasury bills and 10-year bills (the yield curve) widened in the last quarter. This means the start of the next recession has been pushed down the road a bit. On current trend, it may not occur until 2019 at the earliest.
Learn more|
If you have any questions or comments about this article, contact Steve Latin-Kasper at 248-479-8193 or stevelk@ntea.com.
For additional resources and statistics to help your company plan for the future, login to ntea.com/marketdata. There, members can find information on:
- U.S. truck sales and registrations
- Box-off truck chassis production and shipments data
- Commodity pricing
- Global commercial truck market data
- Leading indicators Industry forecasts, and more.