By Steve Latin-Kasper, NTEA Director of Market Data & Research
This article was published in the March 2018 edition of NTEA News
The U.S. economic expansion that began in the third quarter of 2009 is now eight years old and already one of the longest on record. The work truck industry has been growing just as long, but in absolute terms, hasn’t recovered from the 2007–2009 recession quite as well as the economy as a whole.
In 2017, the U.S. economy was larger in real terms as compared to 2006. This is also true for some industry segments — but not all have fared as well. Figure 1 shows how the industry’s four cab type segments compared to each other in that time period. As of 2017, strip and cutaway chassis sales were higher than in 2006, while conventional and low cab-over-engine (LCOE) sales were well below.
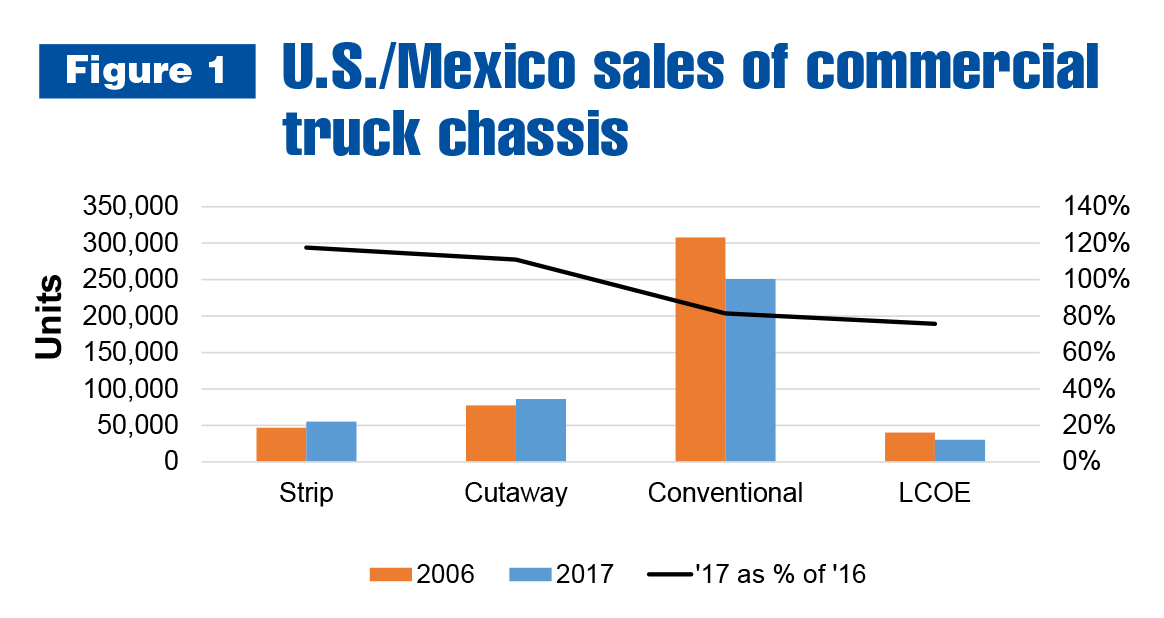
In total, 2017 chassis sales remained about 50,000 units below the 2006 total. A roughly 18,000-unit gain in strip and cutaway sales didn’t come close to making up for an almost 67,000-unit decline in the conventional and LCOE sectors. Conventional sales were about 57,000 units less (19 percent) in 2017 than in 2006.
It’s unlikely strip and cutaway took share away from conventional cab chassis or LCOE. They simply happen to be sold into application markets that did better than average the past few years. Primary strip chassis markets are couriers, recreational vehicles and buses. For cutaways, key sectors include couriers, local delivery (for many markets) and private/public ambulances.
The conventional segment’s failure to recover to prerecession sales levels is likely due to fleets cutting costs. Since the recession occurred during a timeframe in which diesel and gasoline prices reached record highs, fleet managers reacted differently than in previous recessions. Rather than just not replacing old trucks that aged out of the fleet until the next expansion started, they restructured (which partly involved use of alternative fuels). In addition, they downsized to use less total fuel of all types. Part of what made downsizing possible was shifting the mix of weight classes.
In Figure 2, there are clear market share winners and losers in this economic expansion. Class 5 took share away from Classes 4 and 6, and Class 3 took share from Classes 2 and 4. Class 6 took from Class 7, and Class 8 sales remained well below 2006 levels in 2017 (partly because fleets downsized, and to some extent because the heavy-duty sector was impacted more than the rest of the chassis market by the 2015–2017 capital expenditures decline).
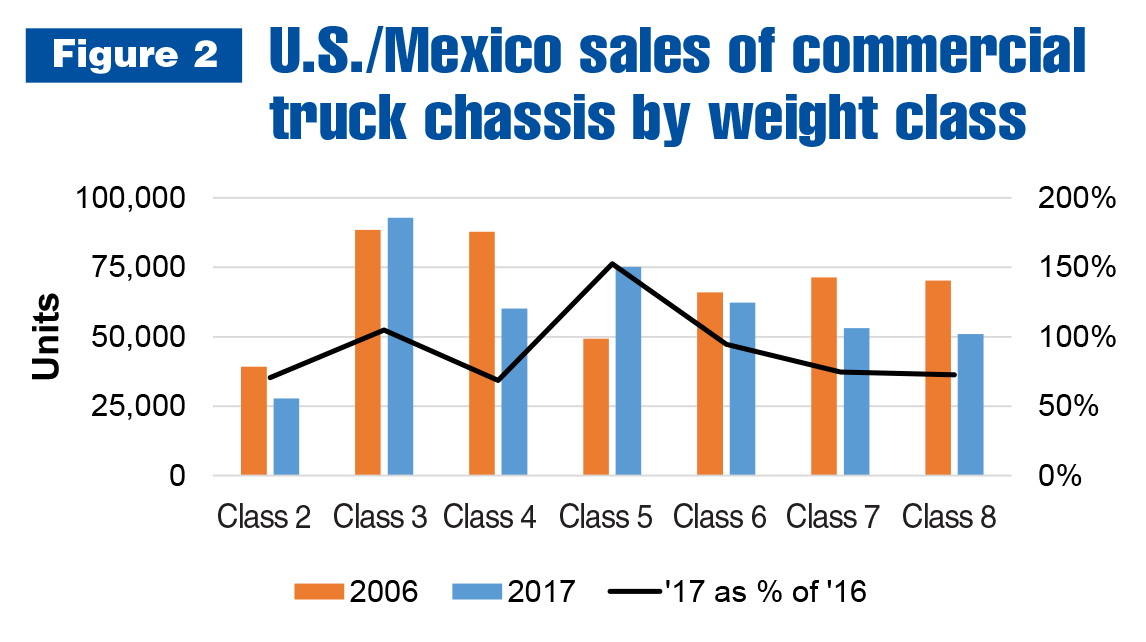
Classes 3 and 5 were on top from 2006–2017 — both taking share from the class below because fleets needed a certain number of trucks with enough power for the job. If you can use one Class 3 to do work previously accomplished with two Class 2 vehicles, you can cut costs. For the same reason, Classes 5 and 6 took share away from Classes 6 and 7. Additionally, to save fuel, Class 4 and 6 trucks were replaced by Class 3 and 5 vehicles.
The end result was smaller fleets with higher average miles per gallon, as well as more alternative fuel usage.
The economic expansion is not over — more sales growth is expected in 2018 and 2019. Class 6 will likely register more sales this year and/or next than it did in 2006. That may not occur in Classes 7 and 8 in this expansion (they will probably rise beyond 2006 levels during the next expansion). Classes 2 and 4 may never get back to 2006 levels. In Class 2, it will be particularly difficult because commercial vans are also cutting into market share.
For more industry market data, visit ntea.com/marketdata.