By Steve Latin-Kasper, NTEA Director of Market Data & Research
This article was published in the January 2018 edition of NTEA News.
U.S. economy
Real gross domestic product (GDP) rose at an annual 3.3 percent rate in the third quarter of 2017, according to the second estimate from Bureau of Economic Analysis. Nonresidential fixed investment, state and local government spending, and private inventory investment were revised up from the prior estimate.
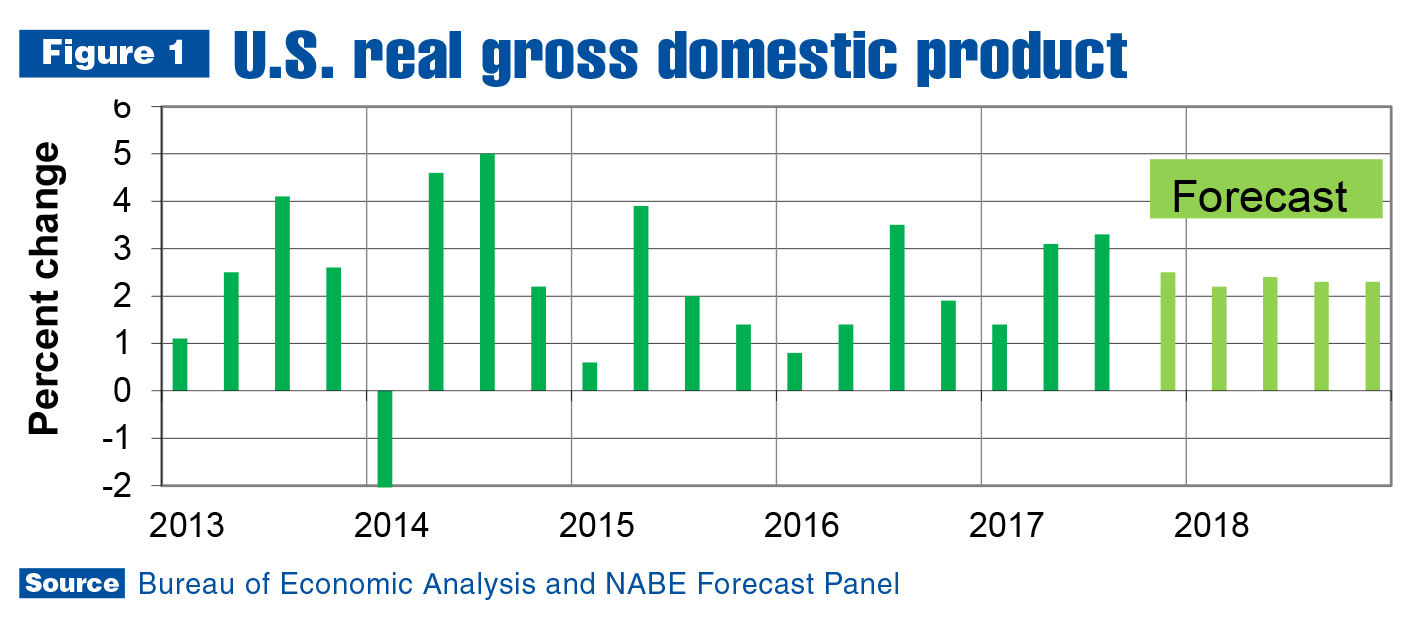
The real GDP increase reflected positive contributions from personal consumption expenditures (PCE), private inventory investment, nonresidential fixed investment and exports that were partly offset by a negative contribution from residential fixed investment.
The acceleration in real GDP reflected an acceleration in private inventory investment, and smaller decreases in state and local government spending and residential fixed investment. The rate of growth improvement was hindered by decelerations in PCE and nonresidential fixed investment.
Since the second-quarter rate of growth was 3.1 percent, the third quarter marked the second consecutive month of GDP growth greater than 3 percent (which hasn’t occurred since the second and third quarters of 2014). Current fourth-quarter expectations are positive, but few economists are predicting a third consecutive quarter of more than 3 percent growth.
PCE decelerated in the third quarter, which is a big reason why the fourth-quarter forecast is lower than 3 percent. However, consumer confidence measures jumped to new highs in October and continued improving in November. That turned into large increases in retail sales on Black Friday and Cyber Monday, which were well above 2016 totals.
While a December retail sales decrease is possible, there is a lot of construction activity in areas that suffered through hurricanes, which will also pump up fourth-quarter GDP. In addition, capital expenditures are continuing to climb. As noted, most consensus forecasts are predicting less than 3 percent growth for the fourth quarter, but the economists anticipating it will be higher have good reasons for their optimism.
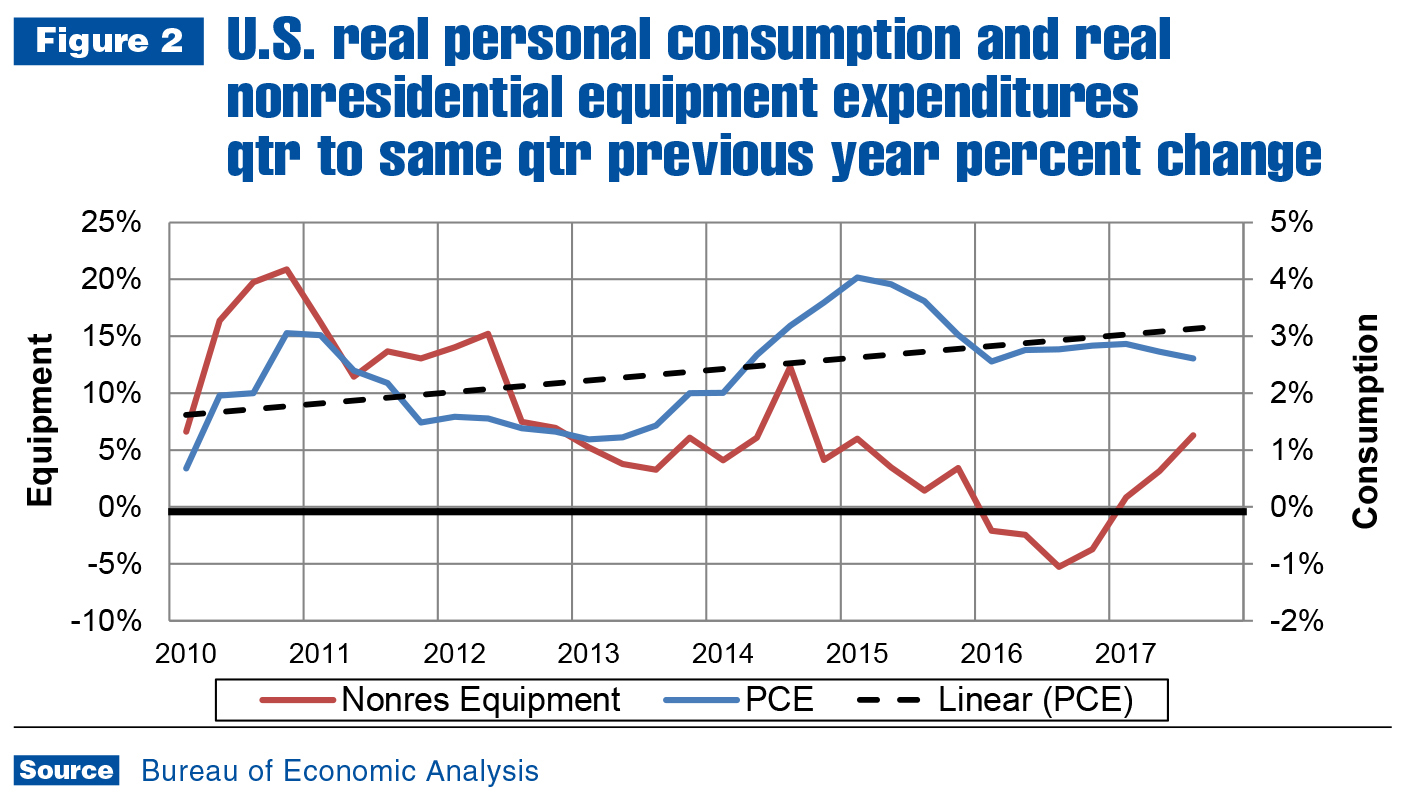
For 2018, consensus forecast panels believe the U.S. economy will grow about 0.2 percentage points faster than in 2017. There is some upside risk to those forecasts. Capital expenditures are accelerating entering the new year, and consumer confidence measures are indicating PCE may accelerate more than expected after the third-quarter deceleration. If that happens, 2018 could be one of the best years in what is now a nine-year-long economic expansion.
Work truck industry
Total U.S./Mexico commercial truck chassis sales increased 16.8 percent in September 2017 as compared to September 2016 — pushing the cumulative total up to 5.3 percent. This is well above the 2 percent forecast presented at NTEA’s 2017 Executive Leadership Summit. The difference can be attributed to faster-than-expected growth in Classes 2, 3 and 5.
Class 2 has been a bit of a roller-coaster this year. Sales grew about 11 percent in the first quarter — well ahead of the rest of the industry — but fell about 5 percent in the second quarter before rebounding in the third with an almost 80 percent growth rate. This partially had to do with low sales in the third quarter of 2016 resulting from the Detroit 3 slowing cab chassis shipments. (Cab chassis were made on the same production lines as pickups, and OEMs couldn’t make pickups fast enough to keep up with demand at the time.)
A lot can change in a year. In the third quarter of 2017, pickup sales were falling, and OEMs caught up with pent-up demand quickly. Through September, Class 2 shipments were 2,000 units higher than sales. Inventory has been building all year, but the rate of build started falling in the second quarter as demand once again began outpacing supply. The story in Class 3 is the same, but percentage changes weren’t as volatile.
The 2017 Class 5 forecast was so low because the market was viewed as saturated. This was not the case as Class 5 clearly took market share away from Classes 4 and 6. Through September, Class 5 sales are up 10.3 percent while Class 4 and 6 sales are down 0.4 and 1.2 percent, respectively.
In Class 8, sales reached a cyclical trough in the first quarter of 2017 and then took off. After falling at a 15.8 percent rate in the first quarter, they grew 1.5 percent in the second and 20.7 percent in the third — reaching an average monthly level of more than 4,500 units. Since growth was accelerating in 2017 and was still falling in the fourth quarter of 2016, the fourth-quarter Class 8 growth rate may reach 30 percent, and end the year with growth of about 5 percent.
In Canada, the market also fared well, but was more volatile. Sales fell at a 2.8 percent rate in the first quarter of the year, followed by 21.4 percent growth in the second quarter — much better than in the U.S./Mexico market. However, while sales growth accelerated in the U.S./Mexico in the third quarter, it decelerated to about 9 percent in Canada.
Through September, Class 6 (the worst-performing segment in the U.S./Mexico) was the best performing sector in Canada, with growth of 95.4 percent. Class 2 (the fastest-growing segment in the U.S./Mexico) is one of the worst in Canada, with a –4.8 percent growth rate.
In the complete vehicle segments, the countries were also out of sync. Tractor sales fell at a quicker rate than in the U.S./Mexico. Commercial van sales, though, are growing faster in Canada.
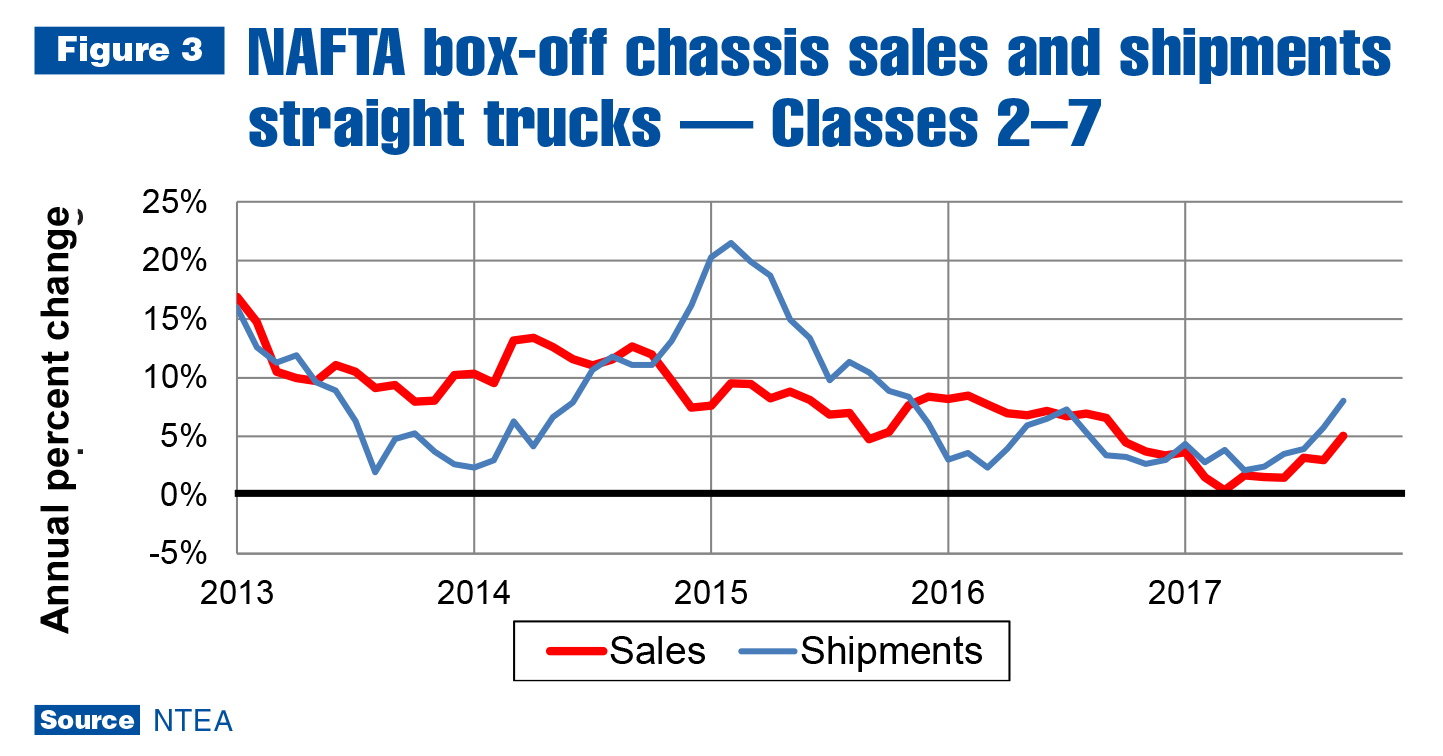
In total, the NAFTA commercial truck and equipment market forecast remains positive for 2018. Growth is expected to continue accelerating through at least the first half of the year. Per IHS Markit, commercial truck chassis sales are expected to increase about 8 percent in 2018 in the U.S., and then slow to about 4 percent growth in 2019. As shown in Figure 3, OEM shipments climbed faster than sales all year, which indicates high future sales expectations.
Metals and energy prices
Steel and aluminum prices were still growing as of October, but the rate of growth was tapering off in both markets. The U.S. price of hot-rolled sheet/strip was up 15.6 percent through October, but was down 1.0 percent for the most recent quarter. Cold-rolled sheet/strip prices were up only 5.3 percent for the year, and down 5.1 percent in the most recent quarter.
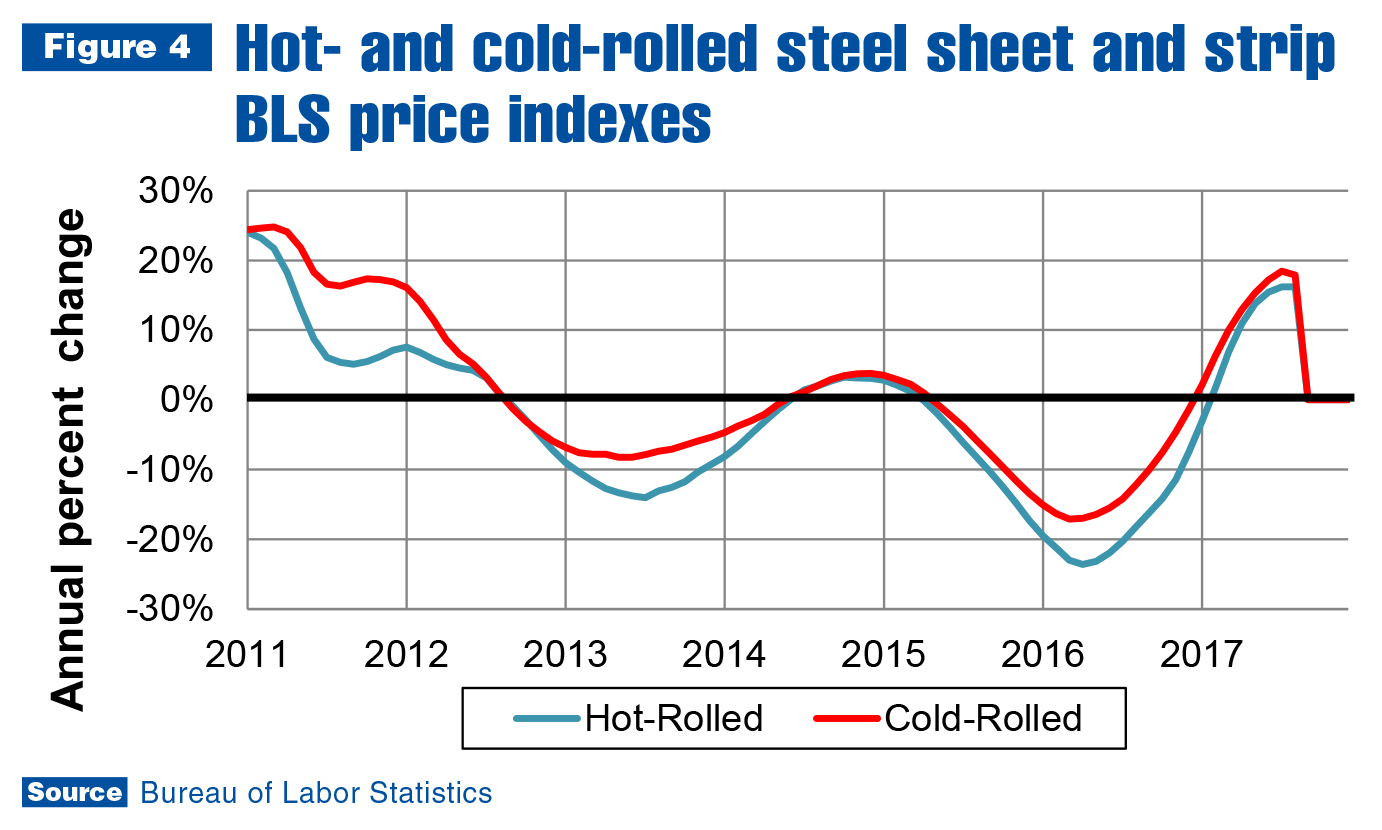
On current trend, steel prices could be falling on an annual basis by the third quarter of 2018, but they are not likely to stay on current trend. Global economic growth is once again accelerating, and while there is a good amount of unused capacity, production will probably increase in line with demand. The steel industry would like to avoid a repeat of 2015 when sheet/strip prices decreased more than
20 percent.
In the aluminum industry, the same cyclical changes are occurring — however, they are happening about three months behind the steel industry. Aluminum prices haven’t peaked yet. As of October, aluminum sheet prices were up 12.8 percent for the year, and 8 percent for the most recent quarter. Scrap prices, which tend to lead sheet prices, were up 14.2 percent for the year. The aluminum sheet price rate of growth is expected to peak soon and decelerate through most of 2018.
The Brent spot price of oil is nearing a monthly average of $60 per barrel — above the $55 predicted by National Association for Business Economics (NABE) in December 2016. In percentage terms, the price of oil is up almost 30 percent for the year, and about 12 percent in the most recent quarter.
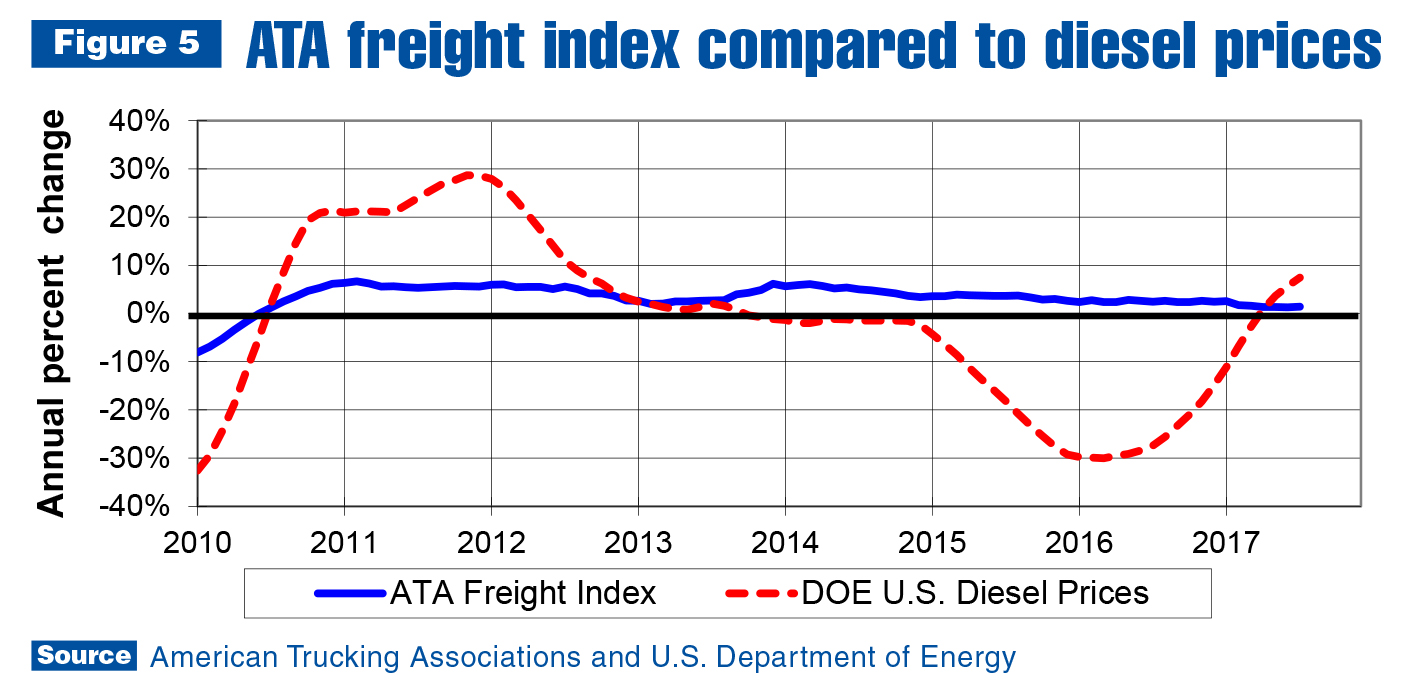
In the U.S., fuel prices are not growing as fast as oil prices, but they are rising fast enough to cause fleet owners to reconsider business plans for 2018. As shown in Figure 5, diesel prices are increasing faster than ATA’s freight shipments index. This means one of the largest costs associated with operating a fleet is rising faster than the amount of freight being shipped. That puts downward pressure on profit margins and affects decisions such as how many trucks will be bought in 2018. This will not prevent it from being a good year for truck sales, but it will likely cause the growth rate to be lower than otherwise.
Leading indicators
Leading indicators, like housing starts and average prime rate of interest, are predicting truck sales growth in 2018. The current residential housing market situation, though, makes it clear there will be some hurdles. Housing starts are well below forecast for 2017, as was the case in 2016. The primary issue is there aren’t enough work crews to keep up with demand. The result is not just a lower rate of growth in housing starts, but higher prices for new and existing houses, and higher rents, which leaves less money in new homeowners’ bank accounts for everything else.
The tight labor market is making it difficult for other industries to keep up with demand as well. In 2018, this will likely put even more upward pressure on wages than in 2017. That would be good for consumption, but could negatively impact capital expenditures and would probably put upward pressure on inflation, which would affect interest rates.
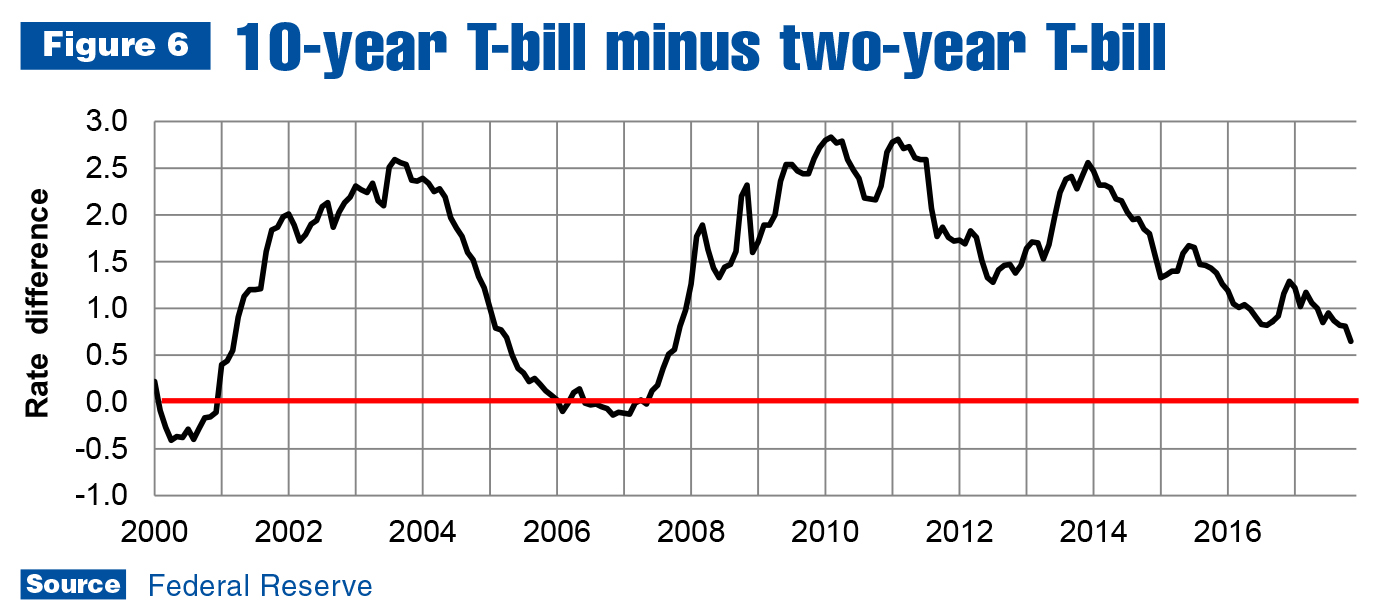
Interest rates will rise at least as much in 2018 as 2017, and maybe more. As shown in Figure 6, the difference between two- and 10-year maturity Treasury bills has been shrinking. What you don’t see in the graph is that both rates have been trending up along with other interest rates. The difference is approaching zero because the two-year rate is rising faster than the 10-year. This indicates the financial sector expectations of future economic growth are getting lower, and a cyclical peak may not be far in the future.
It is highly unlikely the peak will occur in 2018, though, and probably not in 2019. This means work truck industry companies can likely plan for more growth over the next two years.
Learn more
Visit ntea.com/marketdata for more resources and statistics to help your company plan for the future. NTEA members can access information on:
- U.S. truck sales and registrations
- Box-off truck chassis production and shipments data
- Commodity pricing
- Global commercial truck data
- Leading indicators
- Industry forecasts