By Steve Latin-Kasper, NTEA Director of Market Data & Research
This article was published in the October 2018 edition of NTEA News.
Key highlights
- Rising inflation will likely spur continued interest rate increases this year.
- Commercial truck sales forecasts remain positive for 2018 and 2019.
- Work truck industry activity is at historically high levels, with additional growth expected.

U.S. economy
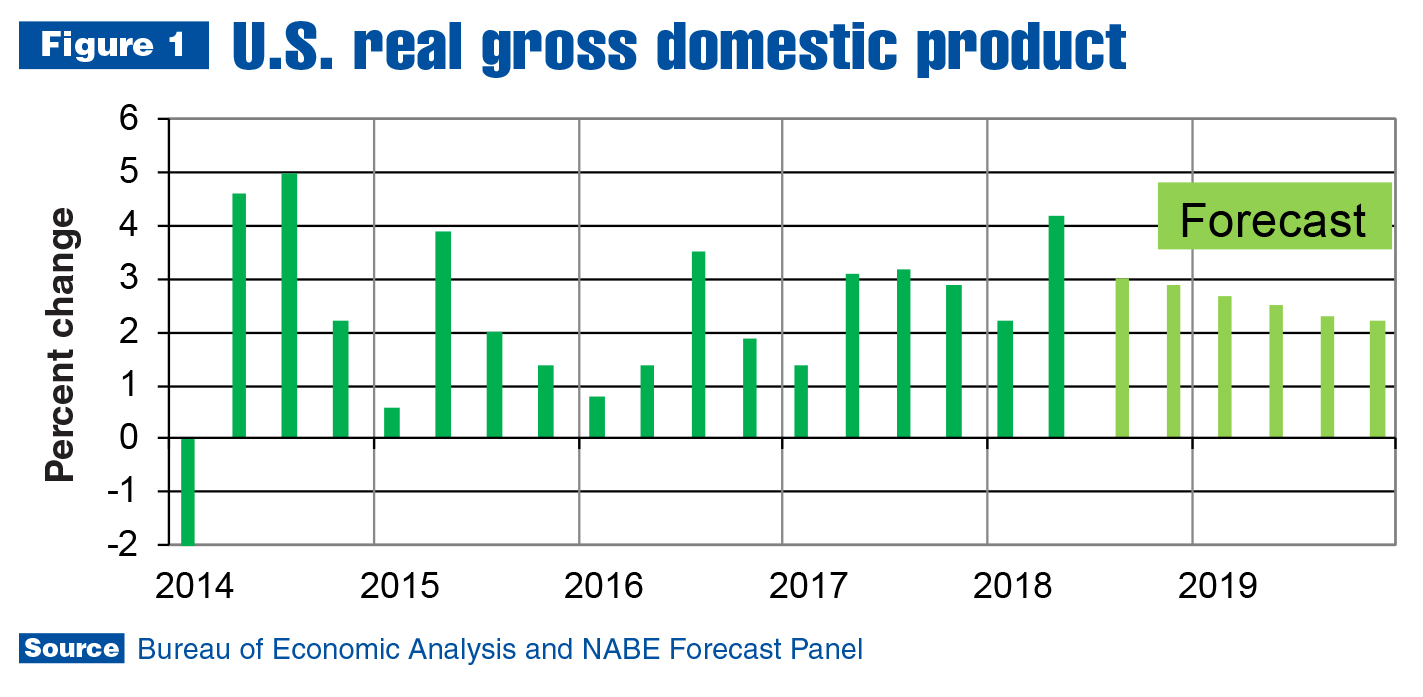
U.S./Mexico commercial truck chassis sales growth decelerated in the second quarter to a 1.3 percent rate — down from 6.7 percent growth in the first quarter. This was the opposite of what happened with the U.S. economy. Gross domestic product (GDP) grew at a 2.2 percent rate in the first quarter and practically doubled to a 4.2 percent rate in the second. This jump reflected accelerations in personal consumption expenditures, exports, federal government spending, and state and local government spending, as well as a smaller decrease in residential fixed investment. These movements were partly offset by a downturn in private inventory investment and deceleration in nonresidential fixed investment.
For the first time in this cyclical expansion, though, inflation accelerated to a concerning level. As a result, Federal Reserve will likely continue raising interest rates this year. Most economists are expecting .25 percentage point increases in September and December, which will make borrowing more expensive, cause the financial sector to tighten credit and potentially lead to an increase in loan defaults for consumers/businesses with variable rate loans.
The labor market remained extremely tight as of August, resulting in the unemployment rate falling back to 3.9 percent. Another measure of the limited labor availability is the increase in the quits rate. This is the number of payroll jobs workers voluntarily quit (usually to take another job) as a percentage of total employment. As of June, the rate reached 2.3 percent, which matched the highest rate reached in the last economic expansion. The quits rate is a leading indicator of economic activity and is probably near the next cyclical peak.
As companies continue offering higher salaries/wages to attract other businesses’ employees, and as the total number of people with jobs keeps rising, consumer expenditures will grow as well. However, consumer and producer prices are essentially pacing the increase in average salary/wage. This means consumers aren’t getting ahead and the savings rate is declining. As savings accounts dwindle and debt as a percentage of income rises, consumer expenditures will decelerate.
In the third quarter of 2018, the economy is still growing, which is good news for the work truck industry, since commercial truck and truck equipment sales tend to increase when the economy grows faster. Although truck sales can be a leading indicator of U.S. economic activity, they clearly lagged in the second quarter, but the trend seems to be changing. Chassis sales have been trending up since April on a month-to-month basis. Sales fell 5.1 percent that month, as compared to April 2017, then rose 0.9, 7.8 and 13.1 percent, respectively, from May through July.
Work truck industry
Figure 2 shows the level of U.S./Mexico Class 2–7 chassis sales throughout the economic expansion that began in 2010, along with annual percent change. The 12-month moving average increased steadily from 2010–2012 and leveled off in 2013. As consumer expenditures accelerated in 2014, so did work truck industry sales. From 2015 through the first half of 2017, the rate of growth trended downward to near zero as a result of declining capital expenditures. When capital expenditures started growing again in the second quarter of 2017, truck chassis sales growth also accelerated, but not for long. The annual rate of growth was again near zero as of June.
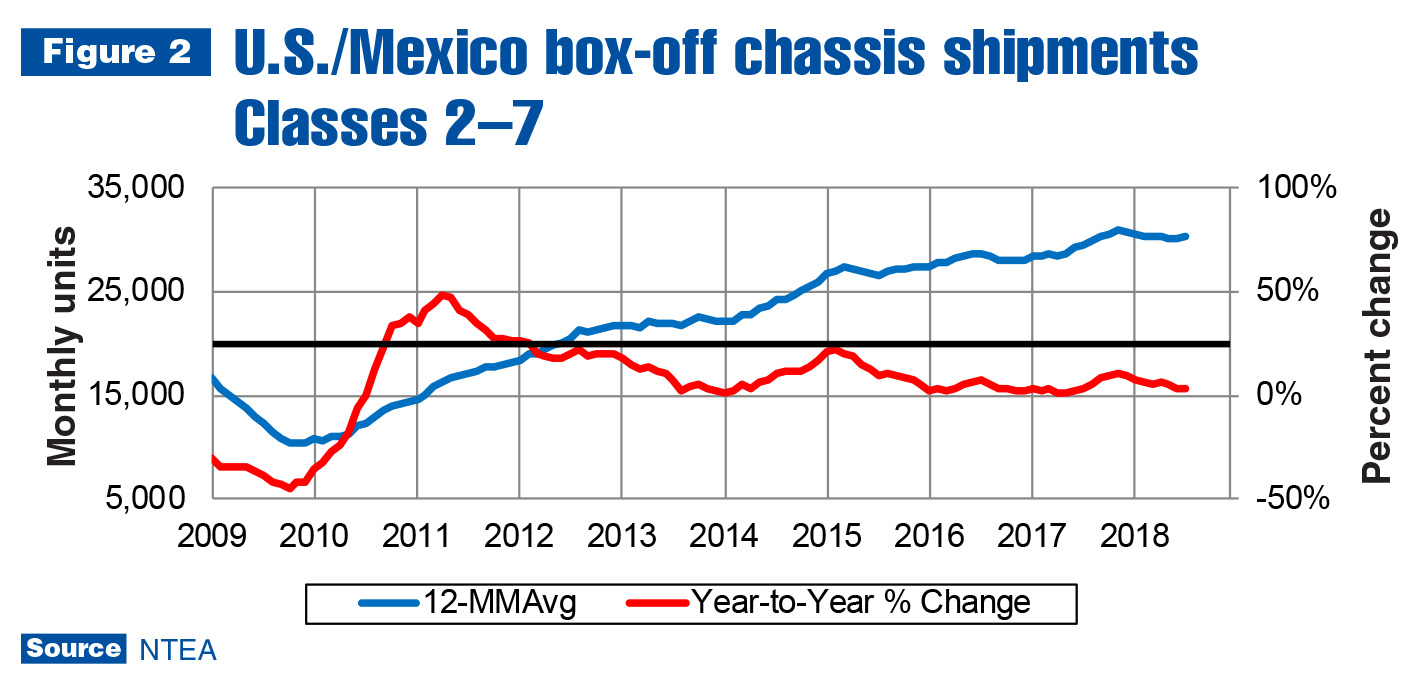
This doesn’t sound particularly good, but further Class 2–7 growth is being hampered by capacity limitations. Plant space could be expanded, but finding labor to staff a new plant would be difficult, to say the least. The tight labor market also prevents running an extra shift in the same plant. Current Class 2–7 sales averaged about 31,500 units through the first half of this year — just 2,000 units behind the 2006 peak.
In 2006, Class 2–7 sales increased about 1,000 units per month as compared to 2015, which seemingly indicates that as we approach the peak of this expansion, there should be room for growth. However, the unemployment rate averaged 4.7 percent in the first half of 2006 — almost a full percentage point higher than the 3.9 percent average for the first half of 2018. This means current Class 2–7 production and sales levels are about as high as they can get.
Recent history looked very different in Class 8. The impact of the 2015–2017 capital expenditures downturn had a greater impact on Class 8 than was the case in Classes 2–7, as shown in Figure 3. Class 8 experienced a recession for almost two years before starting to grow again in the fourth quarter of 2017. As of the end of the second quarter of this year, the rate of growth appears to have peaked.
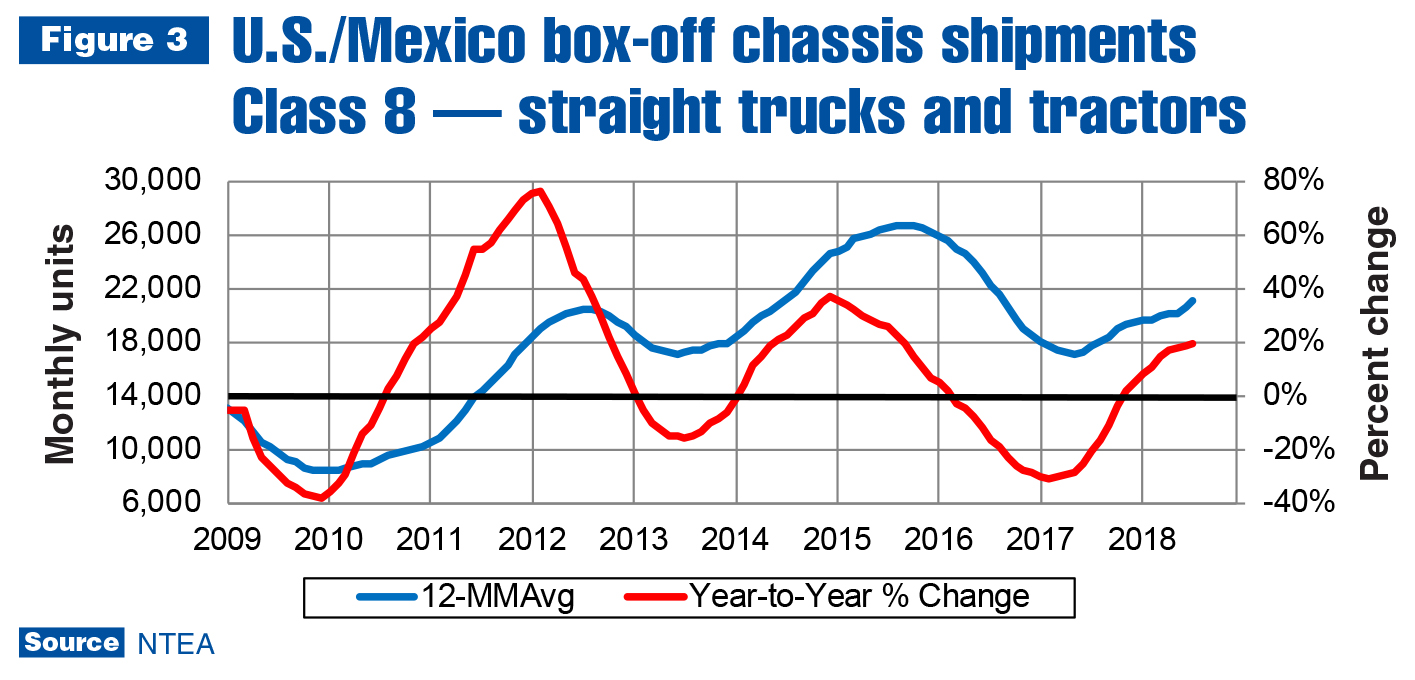
Most of the Class 8 growth was in the tractor segment. In 2017, sales of Class 8 straight trucks rose 6.3 percent while tractor sales climbed 1.3 percent. In the first half of 2018, though, straight truck sales rose 4.9 percent, and tractor sales jumped 31.1 percent. This was primarily the result of large increases in freight shipments, which required freight forwarding companies to replace old tractors, and in some cases, expand their fleets. Tractor orders were high in the second quarter, and growth is expected to continue, but the rate will likely decelerate as third- and fourth-quarter annual comparisons become more difficult.
IHS Markit’s commercial truck sales forecast remains positive for 2018 and 2019 (although, the July 2018 update was revised downward from December 2017 predictions for both years). Class 3–7 sales are expected to increase 1.5 percent this year and accelerate to 4.4 percent in 2019. Class 3–8 sales are predicted to rise 7.1 percent in 2018 and decelerate to 5.3 percent next year.
Metals and energy prices
As shown in Figure 4, cold-rolled sheet/strip and hot-rolled plate/bar prices were increasing at an accelerating rate even before steel tariffs were imposed by the U.S. — primarily due to global economic growth. In fact, tariffs didn’t have much of an impact on the trend after imposition. The growth rate likely would have tapered off in the second quarter of this year, though, if tariffs hadn’t been imposed. In the quarter from May to July, cold-rolled sheet/strip and hot-rolled plate/bar prices rose 7.7 and 7.5 percent, respectively. The rate is already decelerating in the plate/bar segment.
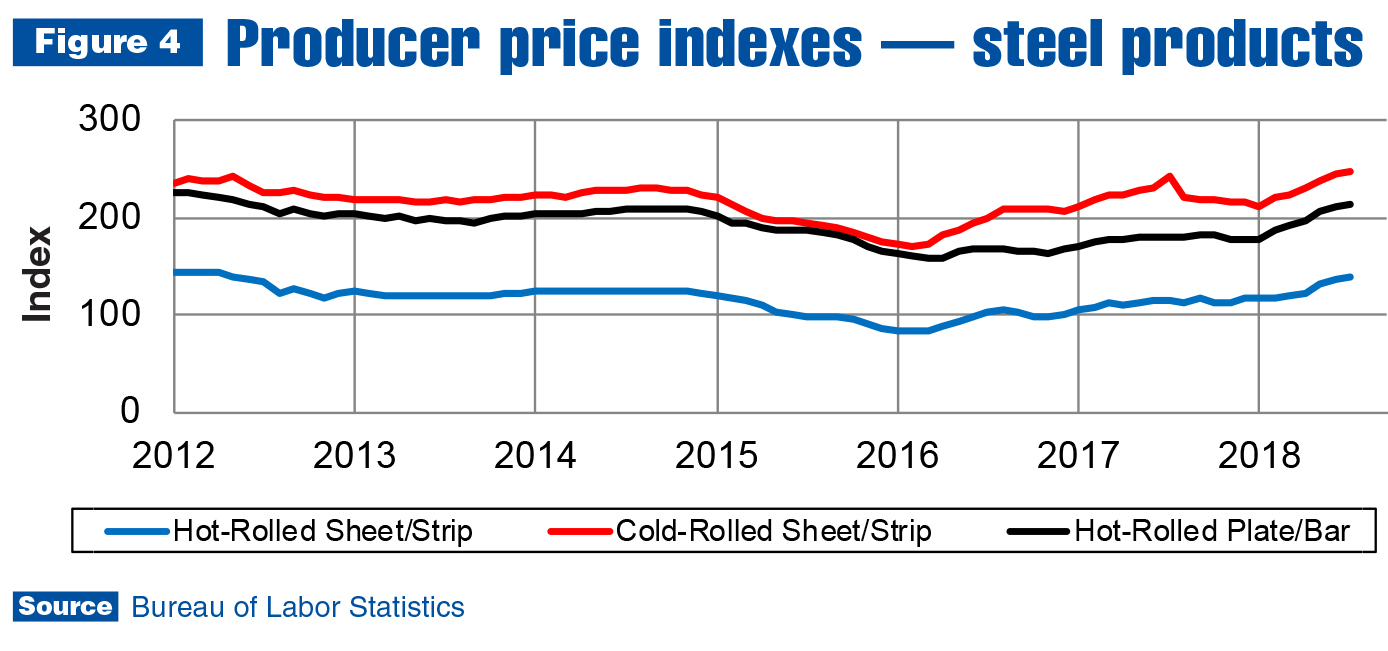
Tariffs had a greater effect on the hot-rolled sheet/strip segment. In July, prices were up 15 percent on an annual basis, and 22.3 percent for the quarter. Prices are expected to continue rising through the third quarter at least. The extent of future increases will depend on other countries’ responses to U.S. tariffs and resulting impacts on global supply chains.
Tariffs had a similar influence on aluminum product markets. Aluminum sheet prices rose 2.4 percent in the most recent quarter and about 19 percent for the year as of July. The tariffs imposition was initially expected to lead to continually increasing prices until they were fully priced in, but it appears the aluminum and steel industries are finding it difficult to add the full extent of the tariffs to their prices. This is primarily due to global excess capacity and slowing construction industry activity in China.
The Brent spot price of oil per barrel averaged $74.25 in July, fell below $70 in August and bounced up again toward the end of the month. Futures contracts activity suggests the price will rise through the end of the year, which can be attributed to decreased summer storage volumes and market adjustments to expected declines in global supply as U.S. economic sanctions on Iran begin to have an impact.
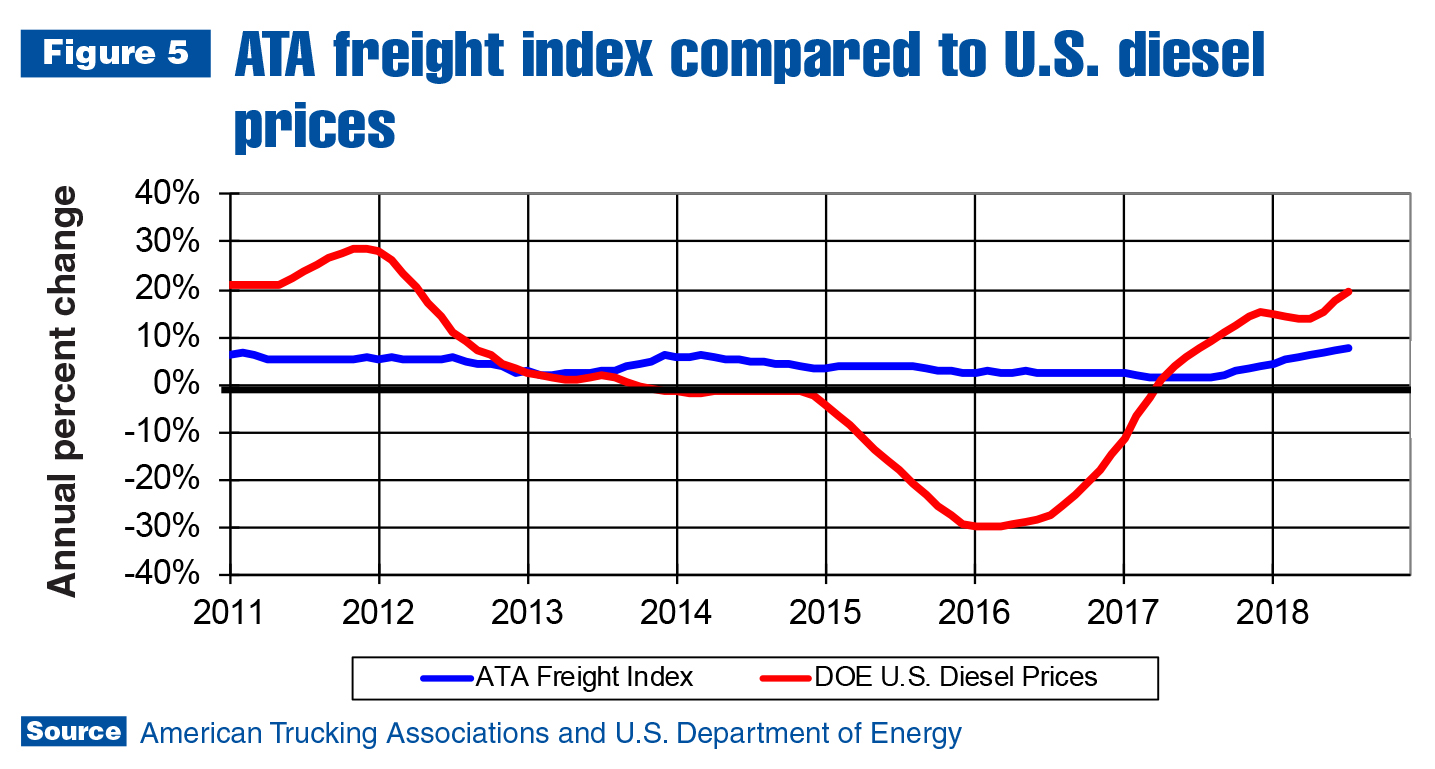
U.S. fuel prices continued rising in July. Diesel was up 4.4 percent in the most recent quarter — a substantial deceleration from an annual increase of more than 20 percent. However, Figure 5 makes it clear that on a month-to-month basis, the rate of increase was accelerating again in the second quarter. As long as the U.S. economy keeps creating jobs, demand for diesel and gasoline should continue putting upward pressure on prices.
Leading indicators
Housing starts grew at a 6.2 percent rate through the first seven months of 2018 — about halfway between the 8 percent growth forecasted by National Association for Business Economics (NABE) and 4.5 percent growth predicted by National Association of Home Builders for 2018. Residential housing market activity shifted from multi-family housing to single-family in 2017, which remained the case in the first half of 2018.
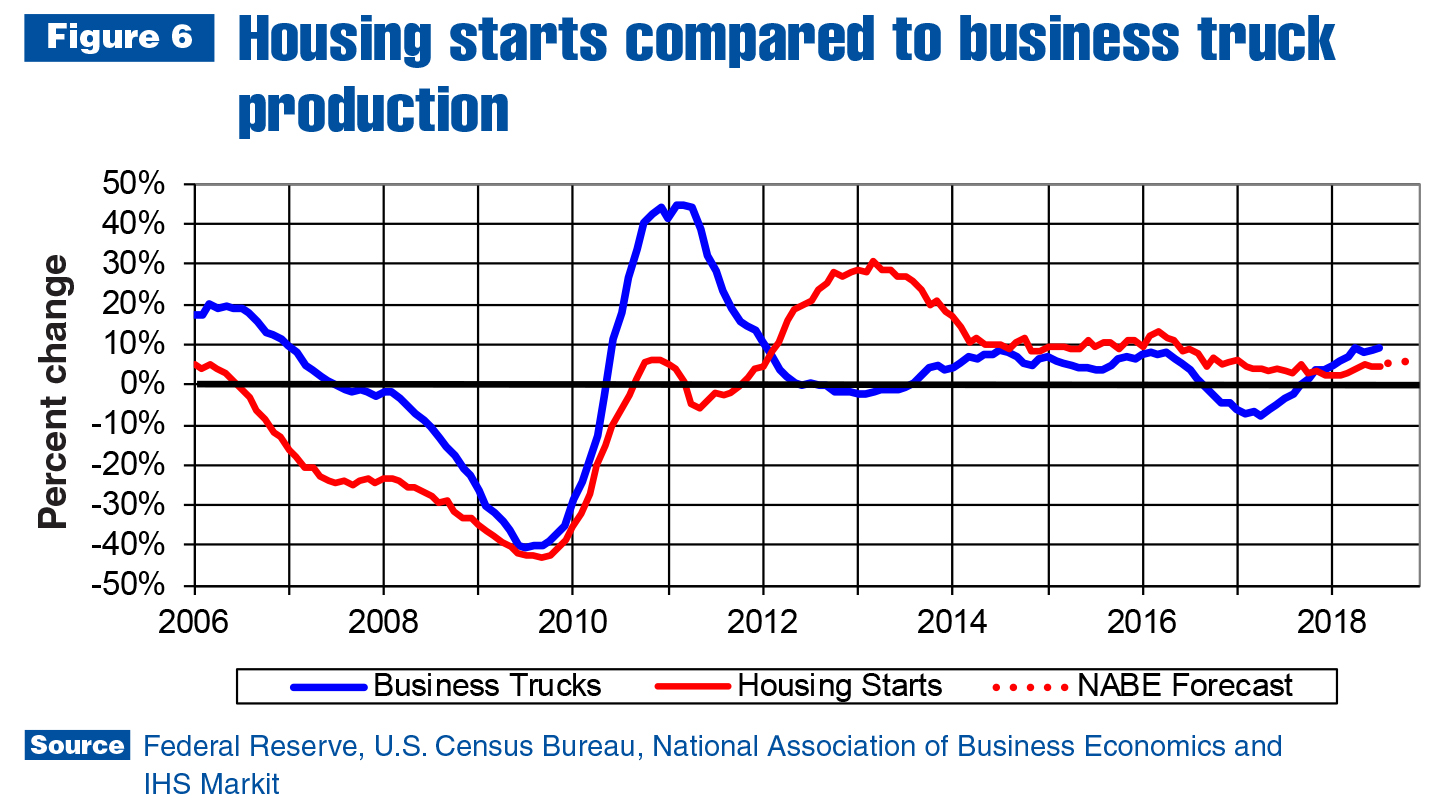
As previously mentioned, interest rates are expected to continue rising. The obvious upward trend caused many potential buyers to enter the market to avoid even higher prices down the road, but the average millennial buyer found prices had already reached unaffordable levels. At the pricier end of the market, though, higher-income Gen Xers are trading up. Home prices seem to be stabilizing, but rising interest rates will continue to make home ownership unaffordable for a number of potential buyers. The rate of growth in the residential segment of the construction sector is expected to decelerate through the end of the year and into 2019.
The forecast for commercial truck and truck equipment sales remains positive for 2018 and 2019, but not quite as optimistic as it was. Rising interest rates in response to increasing inflation are making it difficult for U.S. consumers to get ahead, leading to greater credit card usage and a falling savings rate. The financial sector is clearly concerned, as indicated by a yield curve near inversion.
The bottom line, though, is the U.S. economy is still creating jobs. More jobs lead to more consumption, which means more trucks and truck equipment will be needed in most application markets through the second half of 2019. Work truck industry activity is at historically high levels, and while additional growth could be difficult to manage, it may need to be anticipated in the near term.
Additional resources
For more industry market data and business planning resources, visit ntea.com/marketdata.