By Steve Latin-Kasper, NTEA director of market data & research
This article was published in the July 2019 edition of NTEA News.
Key highlights
- Most economists are not predicting recession until 2021 at the earliest.
- Nonresidential construction growth could trend down in the second half of 2019.
- Work truck industry production and sales levels are expected to remain high.

U.S. economy
U.S./Mexico commercial truck chassis sales growth fell slightly in March — pushing the first-quarter growth rate down to 2.3%, as compared to the first quarter of 2018. In line with the U.S. economy, this was a slight acceleration from 2.1% growth in the fourth quarter of last year. Gains in strip, conventional and low cab-over-engine segments outweighed an 11.1% decline in the cutaway sector.
Canadian commercial truck chassis sales rose 3.6% in the first quarter — a substantial deceleration from 14% growth in the last quarter of 2018. Continued increases in strip, cutaway and conventional segments outweighed a 6.9% decline in low cab-over-engine.
Bureau of Economic Analysis (BEA) revised the first-quarter U.S. economic growth rate downward slightly at the end of May to 3.1%. The initial estimate of first-quarter growth in U.S. gross domestic product (GDP) was 3.2% — a full percentage point acceleration from the 2.2% gain registered in the fourth quarter of 2018.
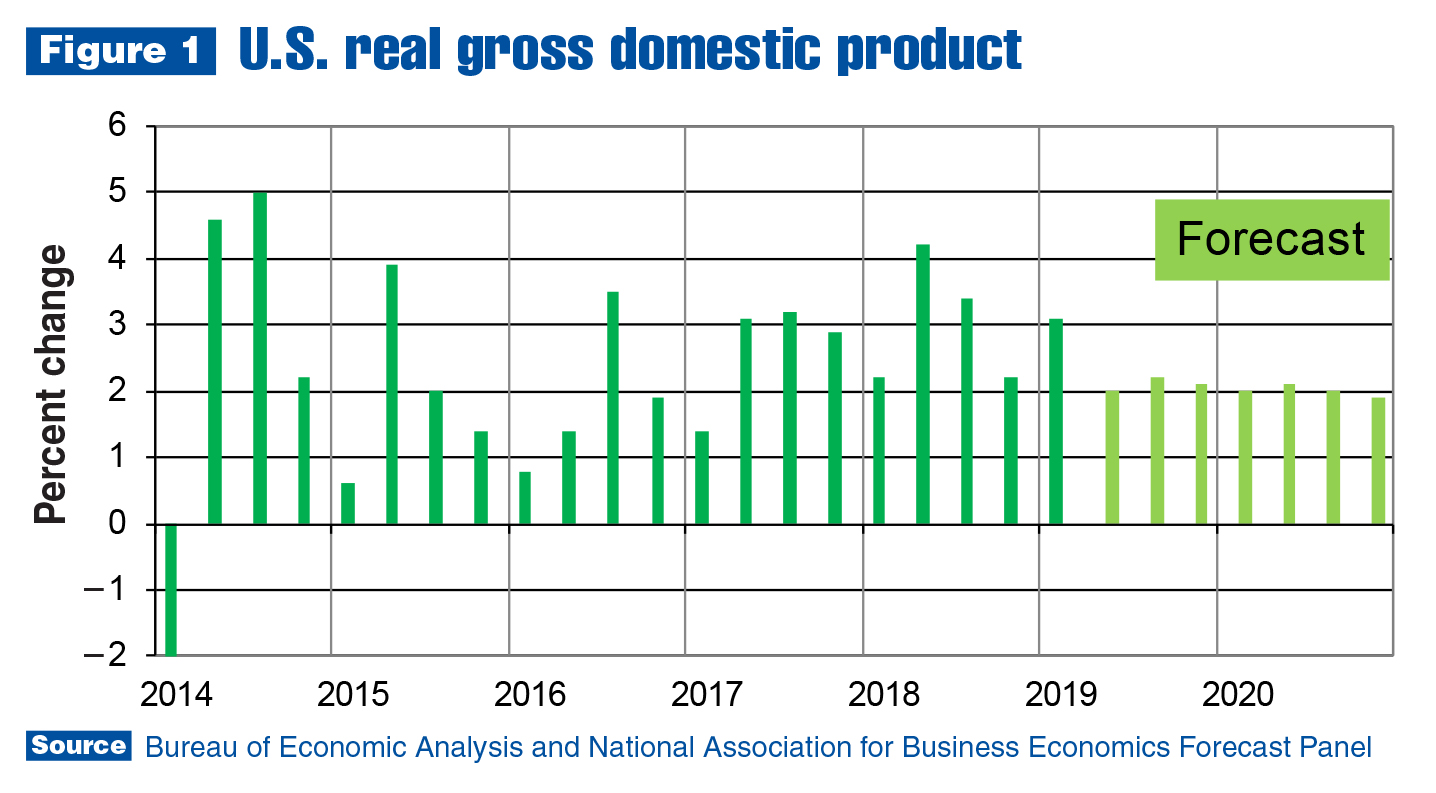
The growth rate acceleration had little impact on consensus economic forecasts. The most recent outlooks from National Association for Business Economics (NABE) and Bloomberg continue to predict growth will decelerate through 2019 and 2020. NABE’s June Outlook calls for 2.4% growth in 2019 and 2% in 2020. Bloomberg anticipates 2.5% and 2% increases, respectively, in 2019 and 2020.
The U.S. economy is clearly near the peak of this cycle (as evidenced by deceleration in agriculture, construction and energy sectors), which is a key reason economists are anticipating growth rate deceleration.
Inflation and unemployment remain manageable. In fact, the misery rate (sum of inflation and unemployment rates) was near an all-time low of 5.8 at the end of April. The most significant limit to growth is a tight labor market. Almost everyone who wants a job has one, which positively impacts consumer spending. However, U.S. companies have 6 million job openings they’re struggling to fill.
Normally, tight labor markets lead to wage increases, which ultimately causes a jump in the inflation rate. Up to now, this hasn’t been the case during the current economic expansion, but consensus forecasts predict wage increases will continue accelerating and grow 3.3% this year. NABE and Bloomberg are predicting a 3.3% average hourly wage increase in 2020 as well. But both forecast panels anticipate the inflation rate will remain around 2% through 2021.
A primary reason for the stable inflation forecast is the expectation the Federal Reserve will keep interest rates low. At the moment, it’s difficult to argue with this prediction. Rates paid for U.S. Treasury bills have been falling, making it unlikely the Fed will raise rates.
However, inflation has more to do with consumer demand than interest rates. If incomes keep rising as expected, and consumers demand more goods and services, the rate of inflation will ultimately depend on whether supply can keep up with demand.
If additional tariffs are placed on Chinese and Mexican imports, it will put upward pressure on inflation. Prices will probably increase in line with the tariffs, and supply chains would potentially be distorted. The latter is especially likely if additional tariffs are placed on Mexican goods. It will affect the work truck industry more than the rest of the economy because the Mexican and U.S. automotive industries are highly integrated.
Work truck industry
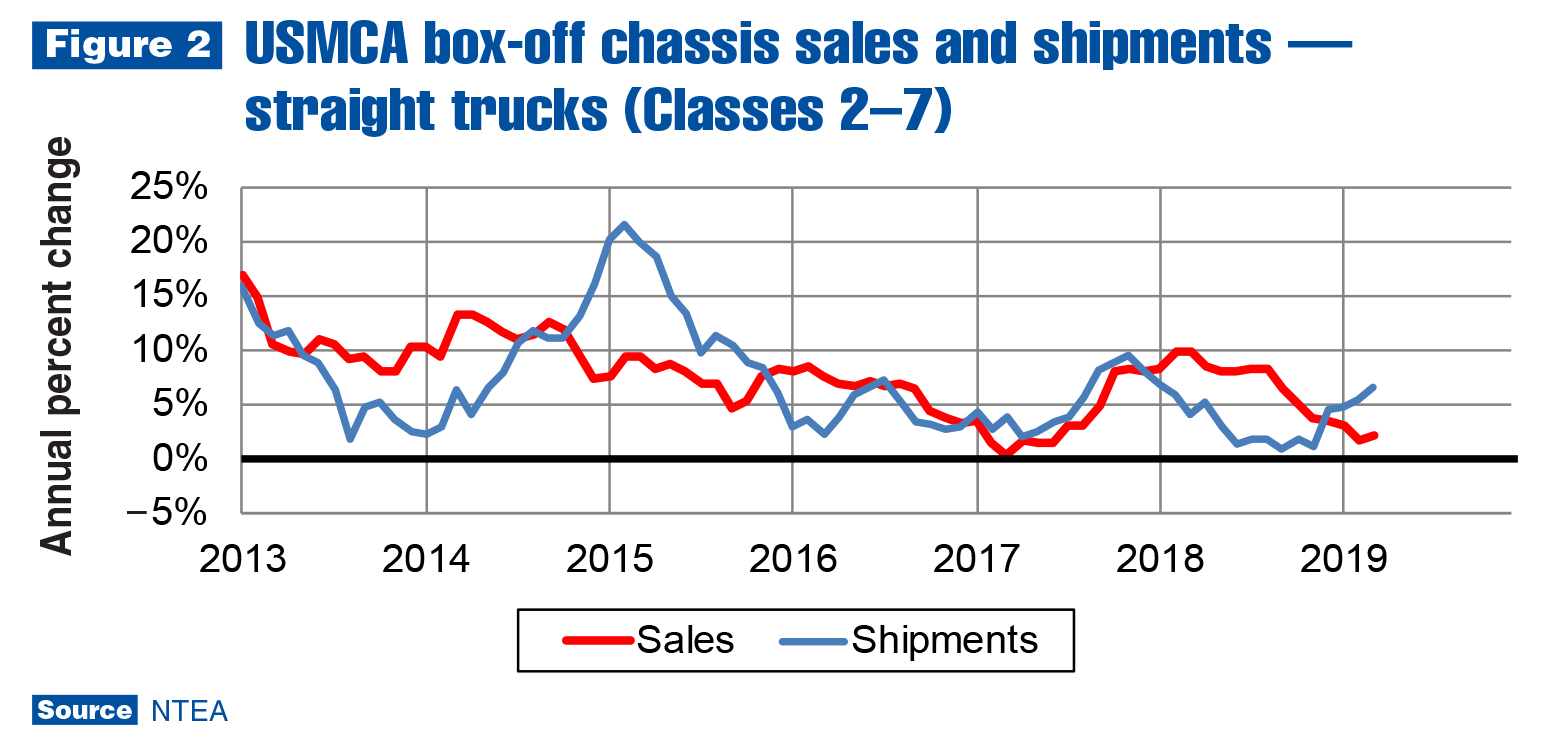
Class 2–7 shipments grew faster than sales in the first quarter, registering 97,976 shipments and 91,851 sales (a 6,125-unit difference). This is a turnaround from the first quarter of 2018 when the difference was –12,526 units. As reflected in Figure 2, the annual rate of change of shipments surged ahead of sales over the past two quarters. The only class in which shipments were lower than sales in the first quarter was Class 7.
The story was essentially the same for Class 8. The 16,810 units shipped was almost 3,000 greater than sales. In the first quarter of 2018, sales outpaced shipments by almost 2,000 units. This is a 5,000-unit swing over the past year — indicating chassis lead times improved in all weight classes, except Class 7.
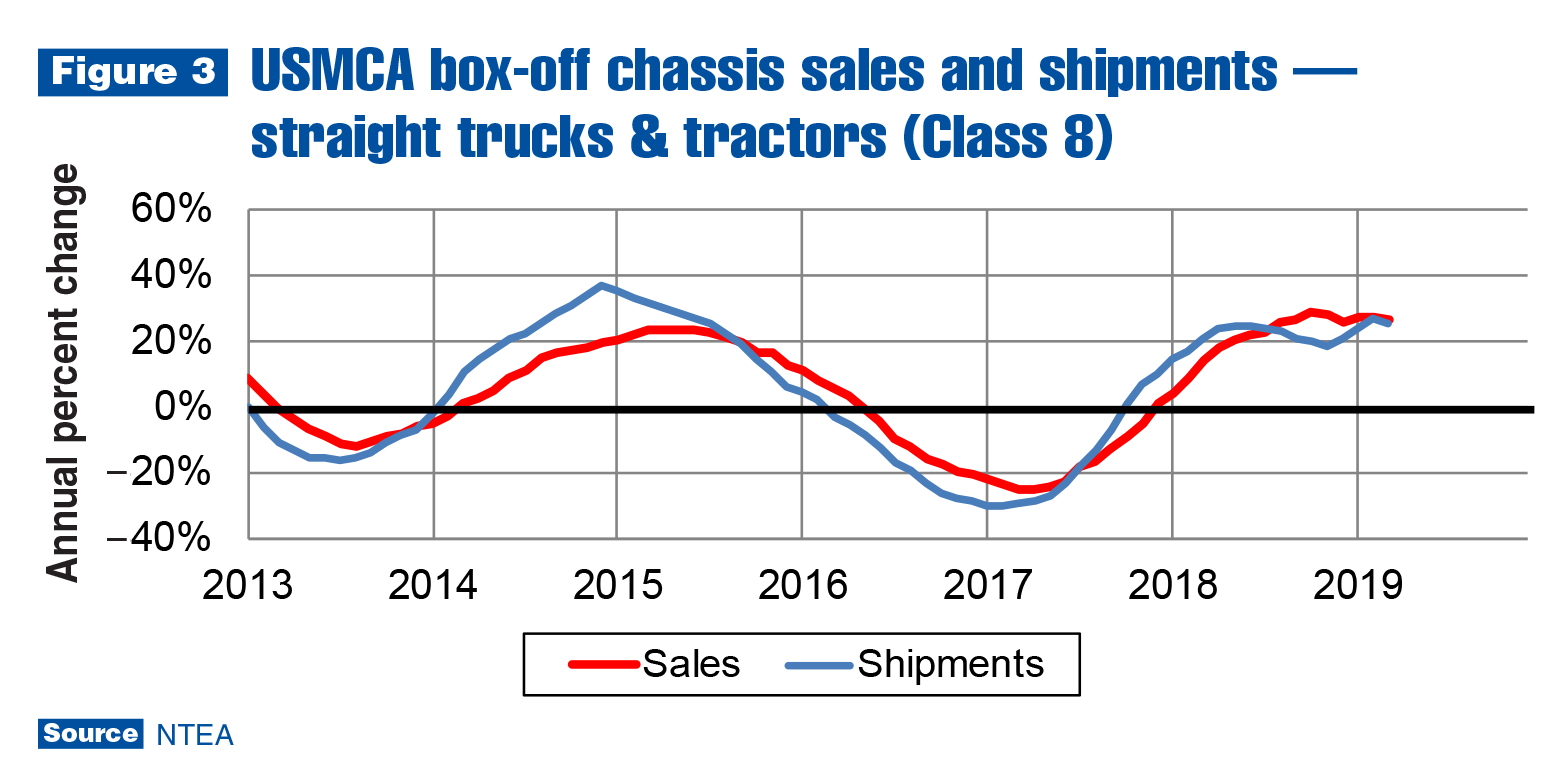
It also means OEM expectations of future sales may have been too optimistic. Figures 2 and 3 show the Class 2–7 sales growth rate is trending down and Class 8 sales growth peaked (and will likely trend down through the second half of this year and into 2020).
Shipments outpaced sales in the complete vehicle markets. In the tractor segment, shipments were 7,606 units higher than sales, indicating a large inventory build in the first quarter. In the commercial van (Classes 1–3) segment, shipments were almost 12,000 units higher than sales.
In Canada, sales grew at a 3.6% rate in the first quarter of 2019, as compared to the first quarter of last year. Differences between segments were substantial. Sales fell at double-digit rates in Classes 2, 3 and 5, and rose at double-digit rates in Classes 4 and 6–8 (there were increases of almost 30% in Classes 4, 6 and 8). Tractor sales jumped 26.4% in the first quarter, marking a deceleration from the 45.4% growth registered in the fourth quarter. Commercial van sales fell at a 0.7% rate in the first quarter — down from 2.6% fourth-quarter growth.
Metals and energy prices
U.S. tariffs on steel and aluminum imports from Canada and Mexico were removed in the first quarter. However, uncertainty remains regarding trade with Mexico as the result of a proclamation that tariffs will be placed on all imports from the country unless its government prevents migrants from reaching the U.S. border by traveling through Mexico. Those tariffs could reach as high as 25%, and if implemented, would significantly affect the U.S. work truck industry in terms of product pricing and supply chain disruption, as well as the rest of the U.S. economy. As of the beginning of June, additional tariffs on imports from Mexico will likely not be implemented, but uncertainty remains the order of the day.
Additionally, U.S./China trade negotiations have stalled, and the country is threatening to retaliate by placing tariffs on a variety of U.S. goods and limiting (or possibly eliminating) rare earths exports to the U.S. Rare earths are used in many high-tech industries, including automotive. Limited availability from China could lower supply and raise prices of products many people use every day, such as computer memory, rechargeable batteries, cell phones, fluorescent lighting, and more.
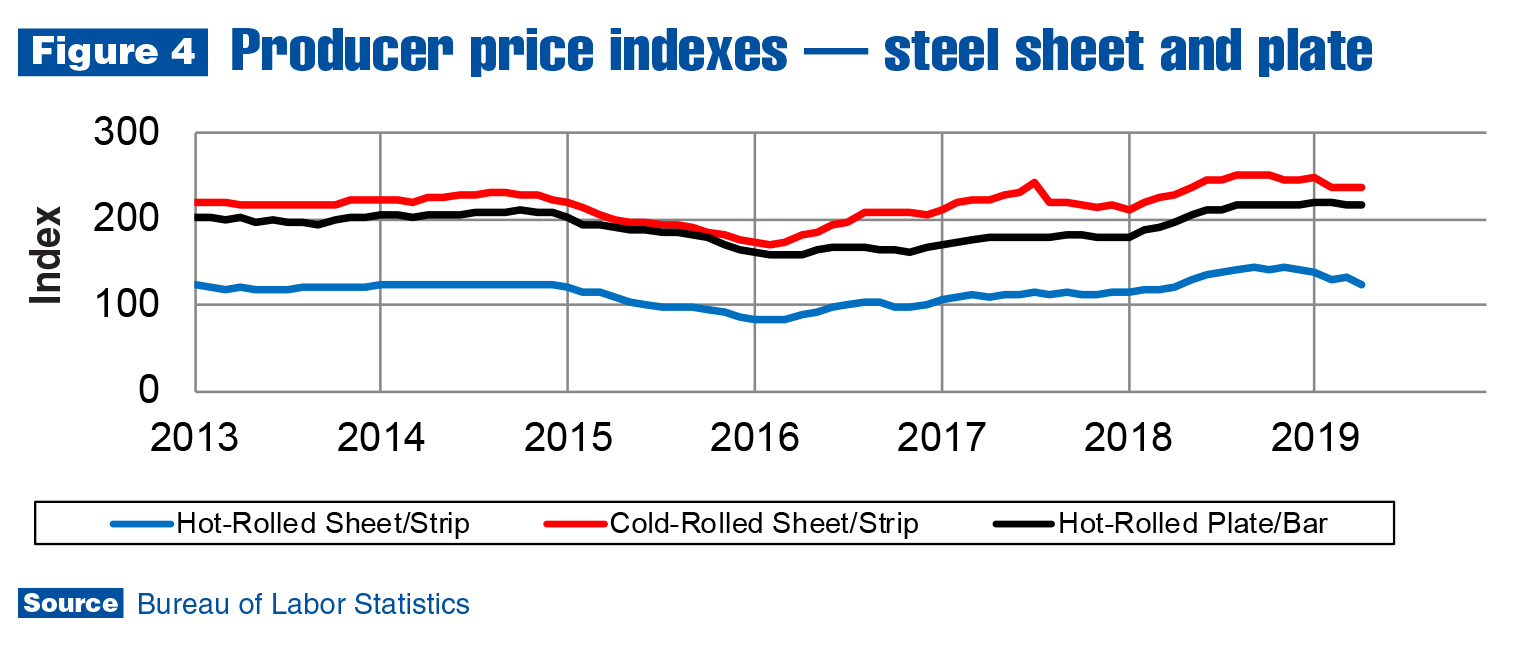
As of the first quarter, though, trade-related economic uncertainty is not an issue in the markets for steel products. The removal of tariffs on steel imported from Canada and Mexico matters more. Hot-rolled steel sheet/strip prices remained up 2.5% for the year, but fell 9.4% from January–April. It now appears sheet/strip prices will be down for the year by June and may fall throughout the second half of 2019. Cold-rolled sheet/strip prices are up 3.1% for the year as of April, and down 4.8% since January. Hot-rolled plates/bars/shapes prices are up 9.6% for the year and down 1.7% since January.
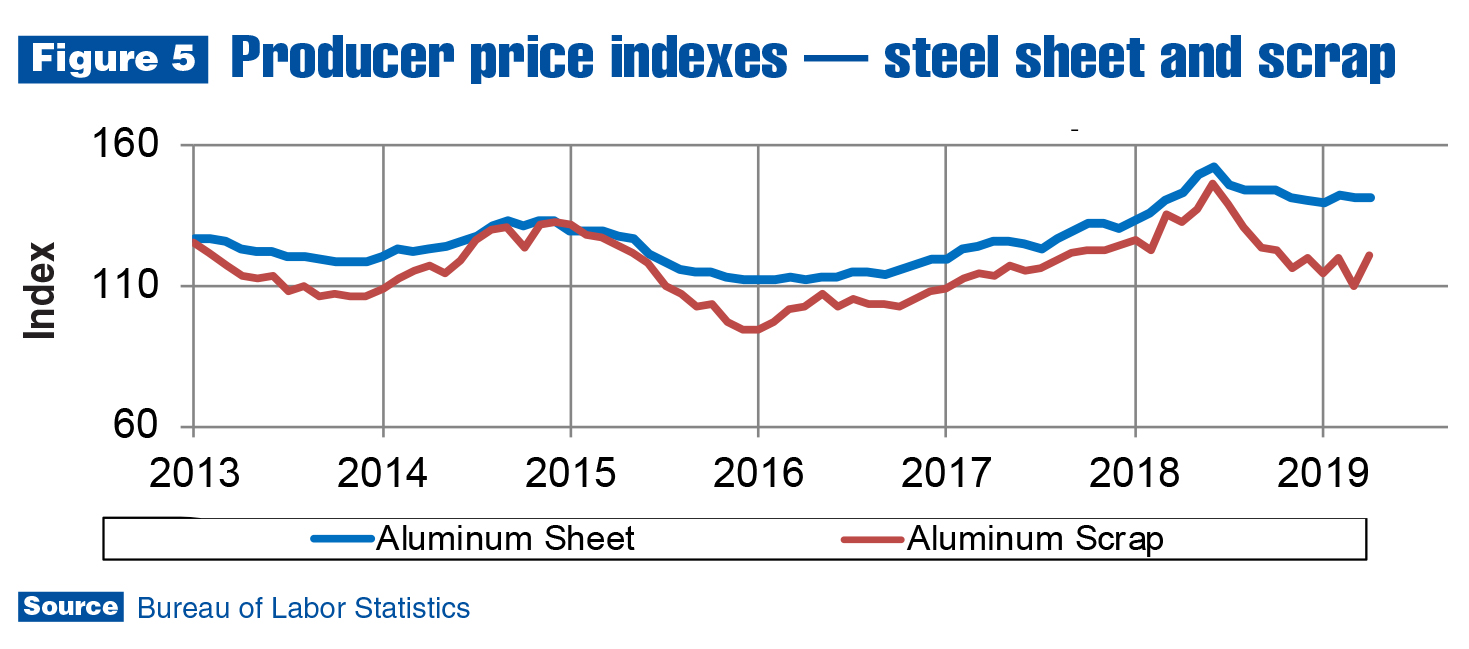
Price trends were different in aluminum product markets, which were not affected by U.S. tariffs imposed in April 2018. Overcapacity and slower growth in China, which consumes 54% of the global total, outweighed the impact of tariffs. Aluminum sheet/strip prices in the U.S. were down 1.3% for the year as of April, but up 1.4% since January. The price spike in the aluminum scrap market should fade by the third quarter.
In May, the price of oil was even more volatile than usual. After publication of U.S. data indicating oil supplies were at a two-year high, the Brent spot price fell from $74.7 per barrel on May 16 to $63.2 on June 3. The West Texas Intermediate price fell from $63 per barrel to $53.25 in the same period — a 15% decline for both benchmarks. Prices started rising again on June 7 after the Saudi Arabian energy minister announced OPEC would put upward pressure on price by cutting supply, and following President Trump’s news that Mexico tariffs scheduled for June 10 implementation might be delayed. Futures prices for July contracts rose almost 3% in one day. NABE’s forecast for December 2019 is $61 per barrel for the Brent spot price — the same as it was the first week of June. If this turns out to be correct, it won’t be because the price didn’t change between June and December. Oil prices are expected to remain volatile.
Leading indicators
As shown in Figure 6, housing starts have been falling since the start of the year and were down 7.2% as of April. This is worse than forecasted, and it’s unlikely the housing market will improve enough over the rest of the year to make up for the substantial decline in the first four months.
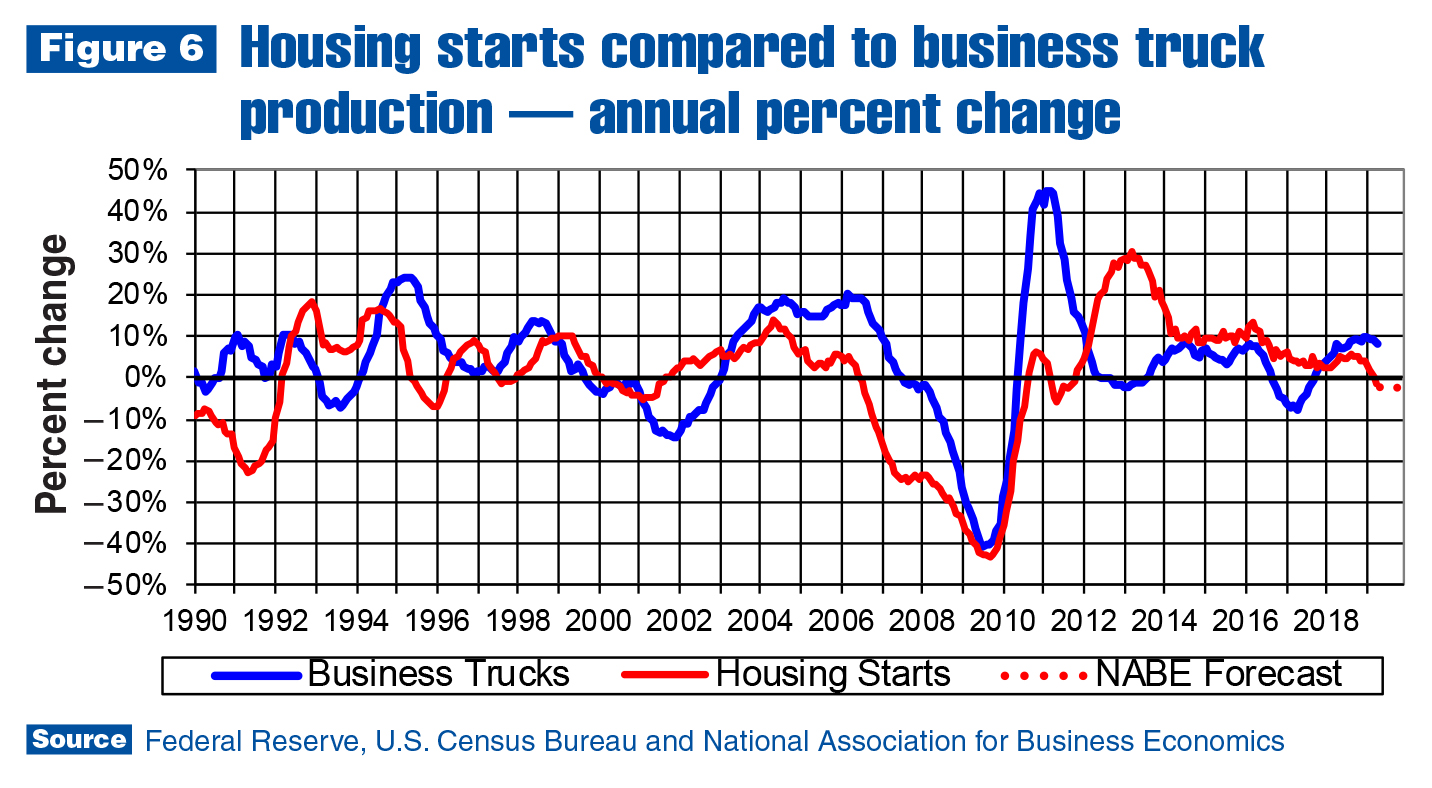
While interest rates are no longer expected to rise this year, it won’t make much of a difference if incomes don’t start growing faster than house prices, and the shortage of affordable homes isn’t alleviated. Growth accelerated in the nonresidential segment of the construction sector in the fourth quarter, but it appears this segment has peaked and could trend down in the second half of the year.
No economic sector was more negatively affected by U.S. tariffs over the past year than agriculture, and the energy sector (oil and natural gas) also slowed. The U.S. oil drill rig count fell from 888 in November 2018 to 789 as of the first week of June. This occurred in the same timeframe as substantial industry consolidation.
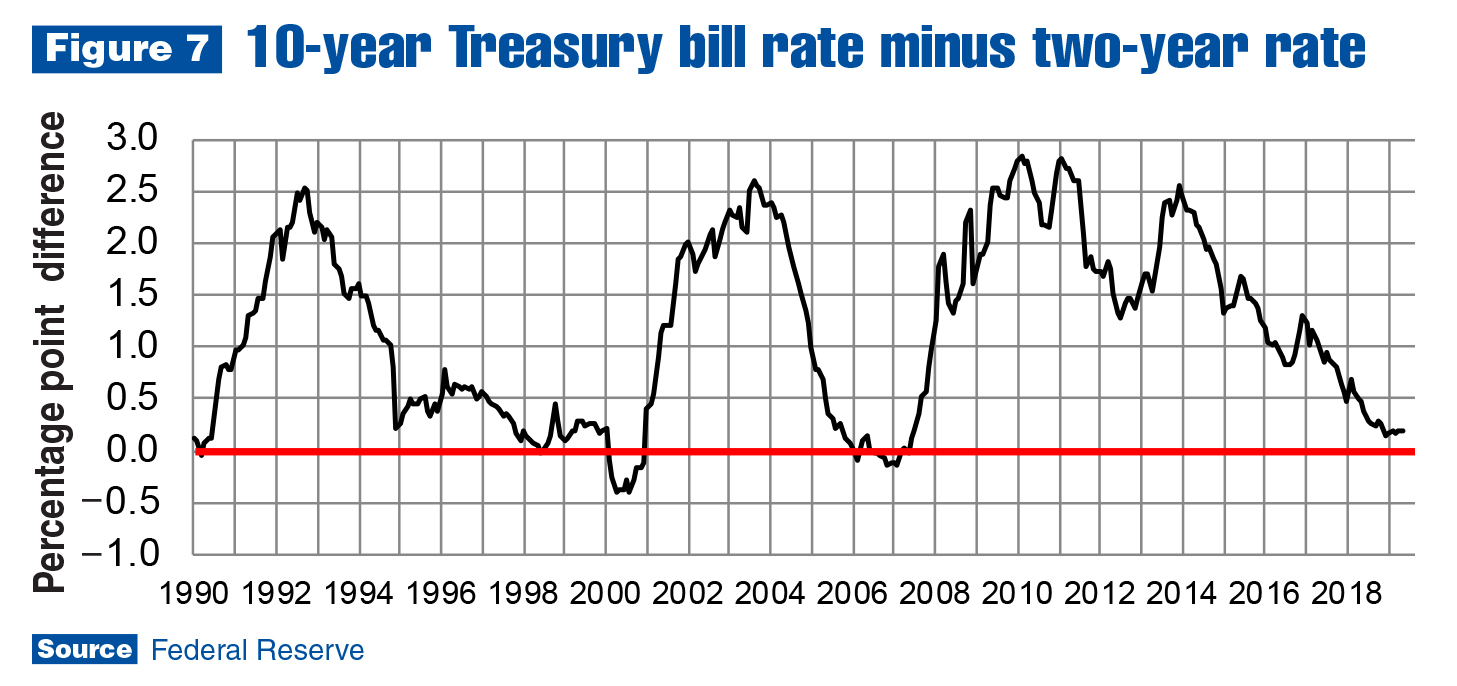
Still, most economists are not predicting recession until 2021 at the earliest. Figure 7 shows the yield curve (10-year Treasury bill rate minus the two-year rate) has not crossed the zero line, which is called a yield curve inversion. Inversions have been one of the most reliable indicators of recession since the 1960s. The yield curve stabilized in the first quarter of 2019, similar to the pattern established at the end of the 1990s. The end to this expansion, though, is clearly in sight.
It’s difficult to have a recession when everyone who wants a job has one. It’s also hard for an economy to grow when there is no productive labor left to employ. This will likely result in what some economists are calling a technical recession. Around the first half of 2020, the U.S. economy and work truck industry could reach a production level where one or two quarters of shipments/sales will be less than the same quarters one year earlier. Production and sales will remain at a high level, but growth may stall at that level until demand and supply rebalance in the labor market.
For more industry market data, visit ntea.com/marketdata.