By Steve Latin-Kasper, NTEA Director of Market Data & Research
This article was published in the July 2018 edition of NTEA News. Access issue (member login required)
Key highlights
- Work truck industry sales will likely continue growing throughout 2018 and 2019.
- The rate of growth could start tapering off in the fourth quarter of this year, and decelerate through 2019.
- Some experts expect the next U.S. economic recession to begin in the first half of 2020, but this may need to be revised based on how leading indicators trend over the next year.
U.S. economy
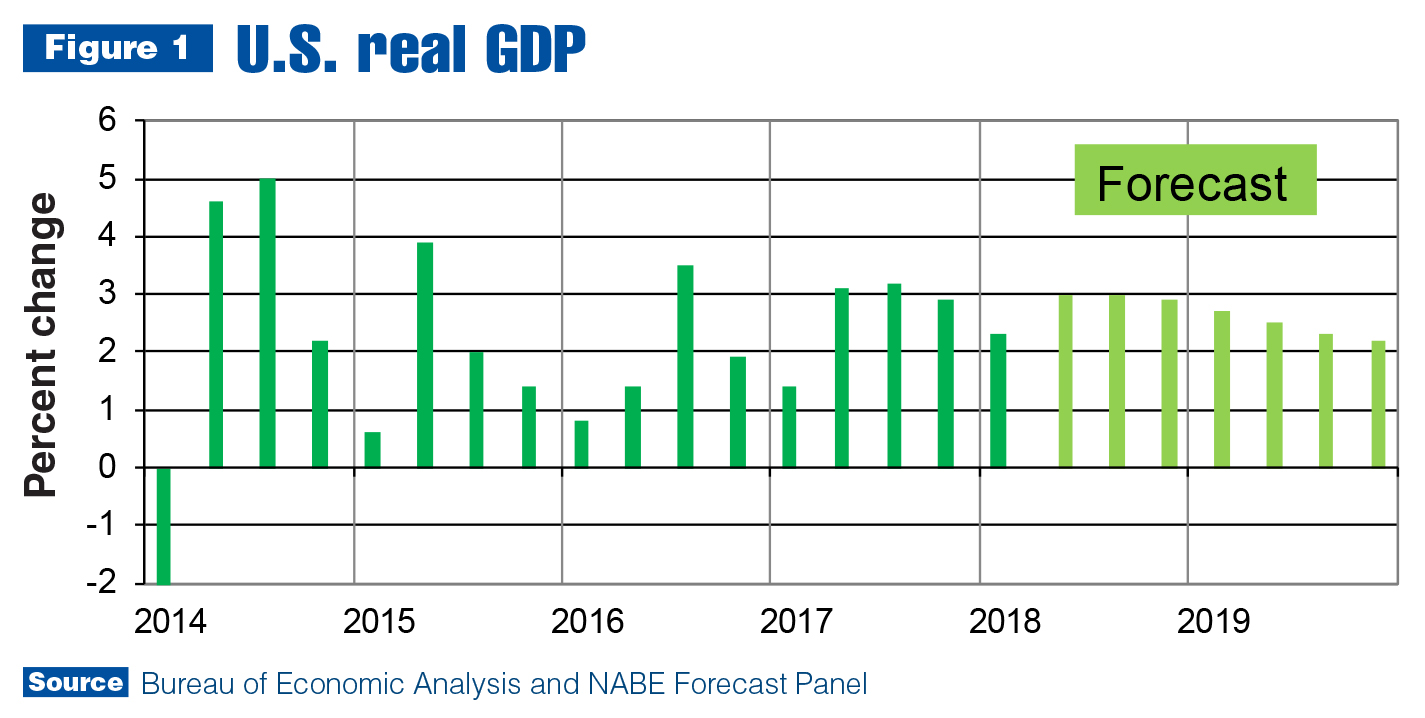
Real gross domestic product (GDP) increased at an annual rate of 2.2 percent in the first quarter of 2018, according to the second estimate released by Bureau of Economic Analysis (BEA). In the fourth quarter of 2017, real GDP rose 2.9 percent. In BEA’s first estimate, the real GDP increase was 2.3 percent. With this second prediction for the first quarter, the general picture of economic growth remains the same — downward revisions to private inventory investment, residential fixed investment and exports were partly offset by an upward revision to nonresidential fixed investment.
The first-quarter deceleration in real GDP growth reflected slowdowns in personal consumption expenditures (PCE), exports, state and local government spending, and federal government spending as well as a downturn in residential fixed investment. These movements were partly offset by an upturn in private inventory investment and a larger increase in nonresidential fixed investment.
GDP growth is expected to accelerate in the second quarter. Net new jobs created in May was well above estimates at more than 220,000. The labor market remains tight, which led to wage increases. This is good and bad, as increased wages lead to higher PCE, but tend to cause higher inflation.
For the year through May, the consumer price index (CPI) was up 2.5 percent — primarily due to housing and energy. The price of fuel oil increased 22.6 percent since May 2017, and gasoline rose 13.4 percent. The price of housing (rent and mortgage) jumped 3.4 percent. In total, food prices climbed only 1.4 percent. The price increases for what most people consider necessities make it difficult to raise expenditures on anything else.
This means the primary driver supporting continued increases in PCE is new jobs, not wage growth. The percent change in wages should get ahead of the percent change in consumer prices as the labor market tightens even further in the second half of 2018; however, we are nearing the peak of the current economic expansion. As a result, there may not be enough time for rising wages to have a significant impact on PCE growth.
The likely result is slower U.S. economic growth — as expected by the National Association for Business Economics (NABE) forecast panel. In the June NABE Outlook, the forecast for 2018 U.S. GDP fell to 2.8 percent from the 2.9 percent March estimate. More telling is the deceleration of growth expected in 2019, as shown in Figure 1. Half of the economists in NABE’s panel now expect the next recession to begin in the first half of 2020.
Work truck industry
U.S./Mexico commercial truck chassis sales continued growing in the first quarter of 2018, but at a decelerating rate. Chassis sales climbed almost 14 percent in the second half of 2017 and rose about 6.7 percent in the first quarter of this year. The rate of growth should accelerate a bit in the second quarter, along with the U.S. economy.
Sales rose substantially in the strip and cutaway segments in the first quarter of 2018 as compared to the first quarter of last year. Conventional cab sales — the largest market segment — increased 5.6 percent. The low cab-over-engine (LCOE) sector registered a sales decline at a 0.8 percent rate. Before the first quarter, LCOE sales hadn’t decreased for an entire quarter since the third quarter of 2016.
In Classes 2, 4 and 7, sales climbed nearly 20 percent in the first quarter as compared to the first quarter of 2017. Sales rose 6.1 percent in Class 8 and 2.9 percent in Class 6. They were essentially flat for Classes 3 and 5, however, which is worth noting, since the sum of those classes accounted for 40 percent of total straight truck chassis sales. If the industry’s two largest weight class segments remain flat for the rest of the year, it will be difficult to reach the forecasted 8 percent growth rate.
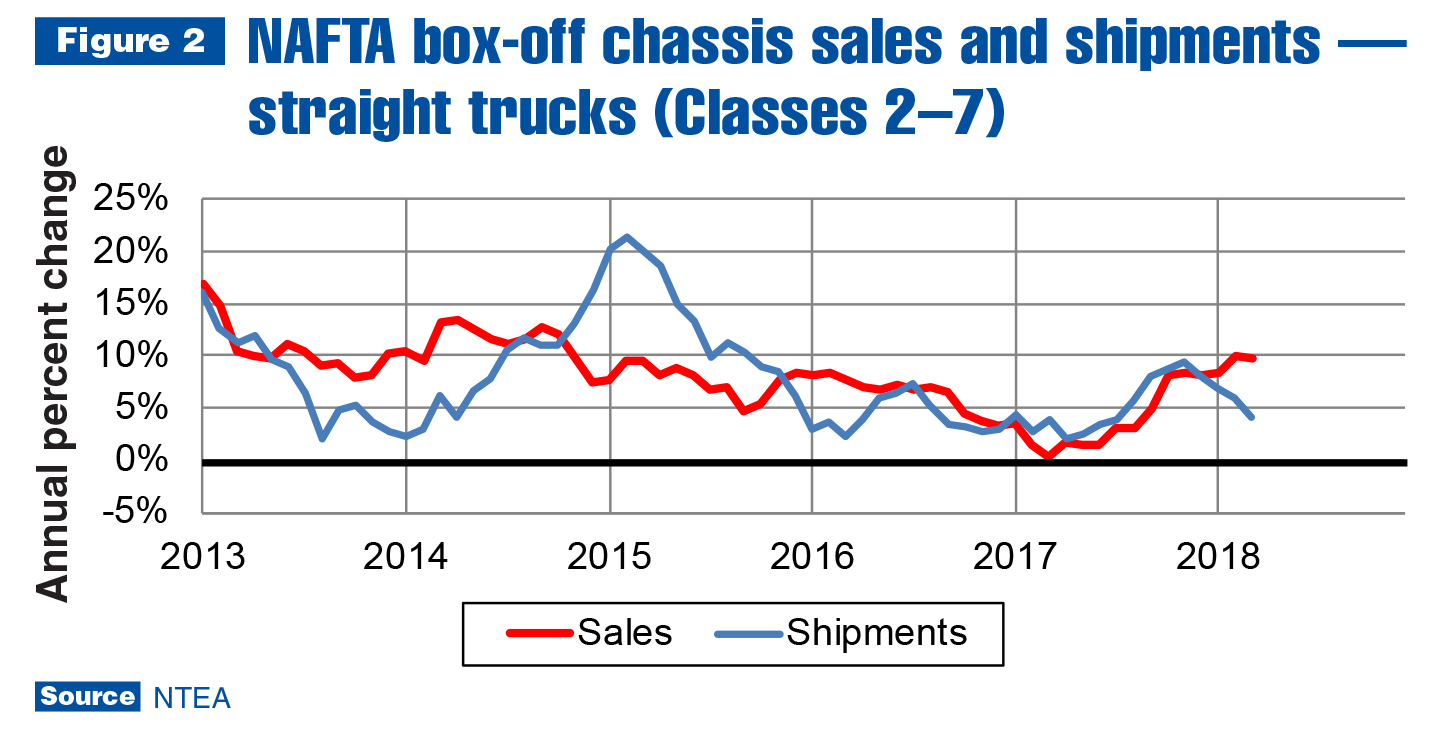
As shown in Figure 2, Class 2–7 shipments decelerated rapidly in the first quarter. To be precise, Class 2–5 shipments slowed while Class 6–7 shipments continued growing. OEM expectations clearly remain high for Class 6–7 sales, and could have degraded for Class 2–5 chassis — but it may simply be they find it difficult to keep up with sales.
In Class 8, tractor sales grew faster than straight truck chassis — and any other industry segment — in the first quarter, at a 34.5 percent rate. This is well ahead of the 20 percent growth predicted at NTEA’s Executive Leadership Summit in October 2017.
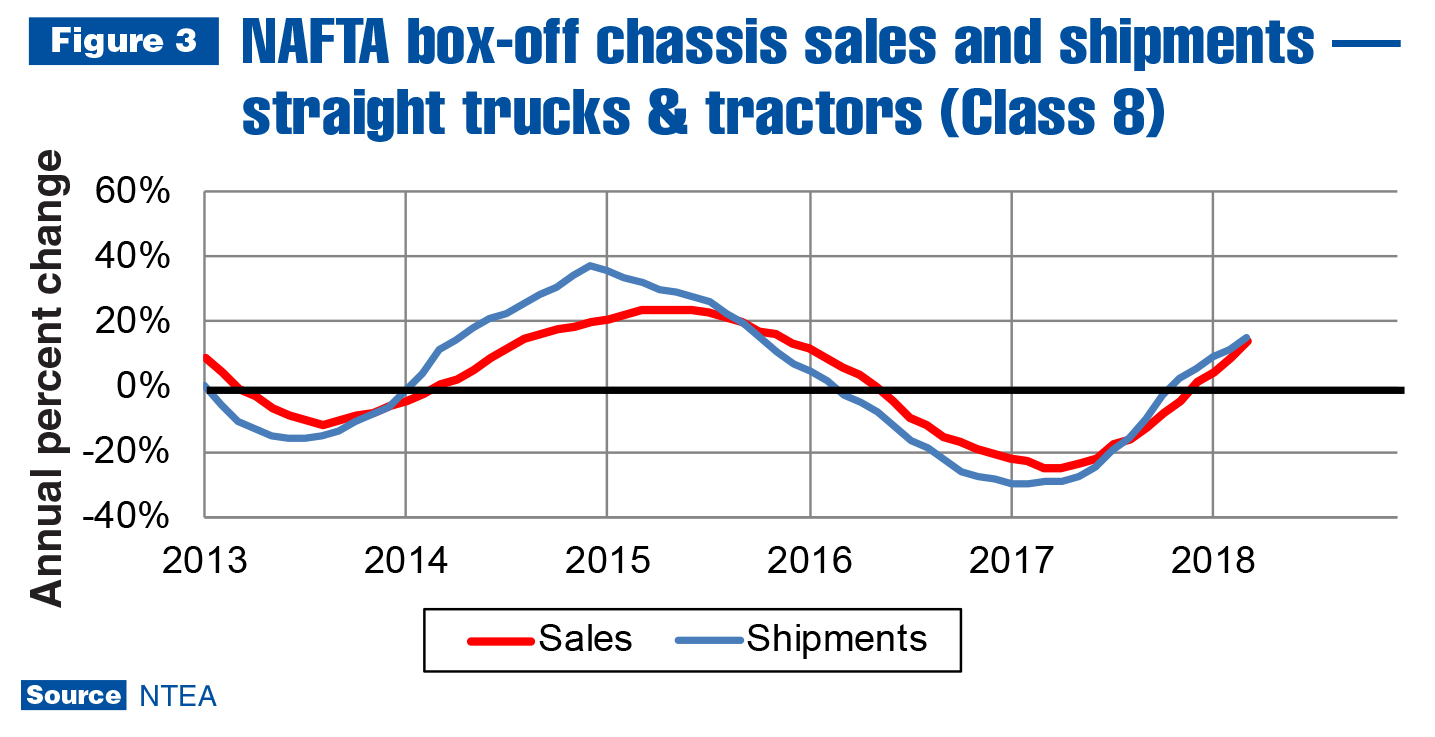
Some industry experts are forecasting 40 percent growth for tractor sales in 2018, but this may be overly optimistic. Tractor sales rose 32 percent in the second half of 2017 as compared to the first half. Year-to-year comparisons will likely slide in the second half of this year as a result. In addition, to achieve 40 percent growth, tractor sales would have to reach 222,000 units this year — about 4,000 units shy of the 2006 record. It is highly unlikely this will happen. A 20 percent gain, which would require sales of 190,000 units, seems realistic.
In the commercial van market, 2018 large fleet sales haven’t materialized to the same extent as last year — resulting in a 12.1 percent first-quarter sales decline. Shipments fell only 10.7 percent, so inventory actually increased in the first quarter.
In Canada, commercial truck chassis sales grew 6 percent in the first quarter of 2018 as compared to the first quarter of 2017. Double-digit growth in the strip and LCOE segments was tempered by slow growth in the cutaway segment and a 1.4 percent decline in the conventional cab sector. Sales rose in all weight classes, except 6 and 8. Sales jumped 42.2 percent for tractors and 4 percent for commercial vans.
Metals and energy prices
As of May, 25 percent tariffs were enacted on steel imported from Canada, Mexico and the European Union (EU), while 10 percent tariffs were enacted on aluminum imports from the same countries. Mexico announced new tariffs in retaliation, and Canada will reveal retaliatory tariffs by July 1. EU initiated a dispute settlement with World Trade Organization and will impose retaliatory tariffs, but did not announce timing before this article was published.
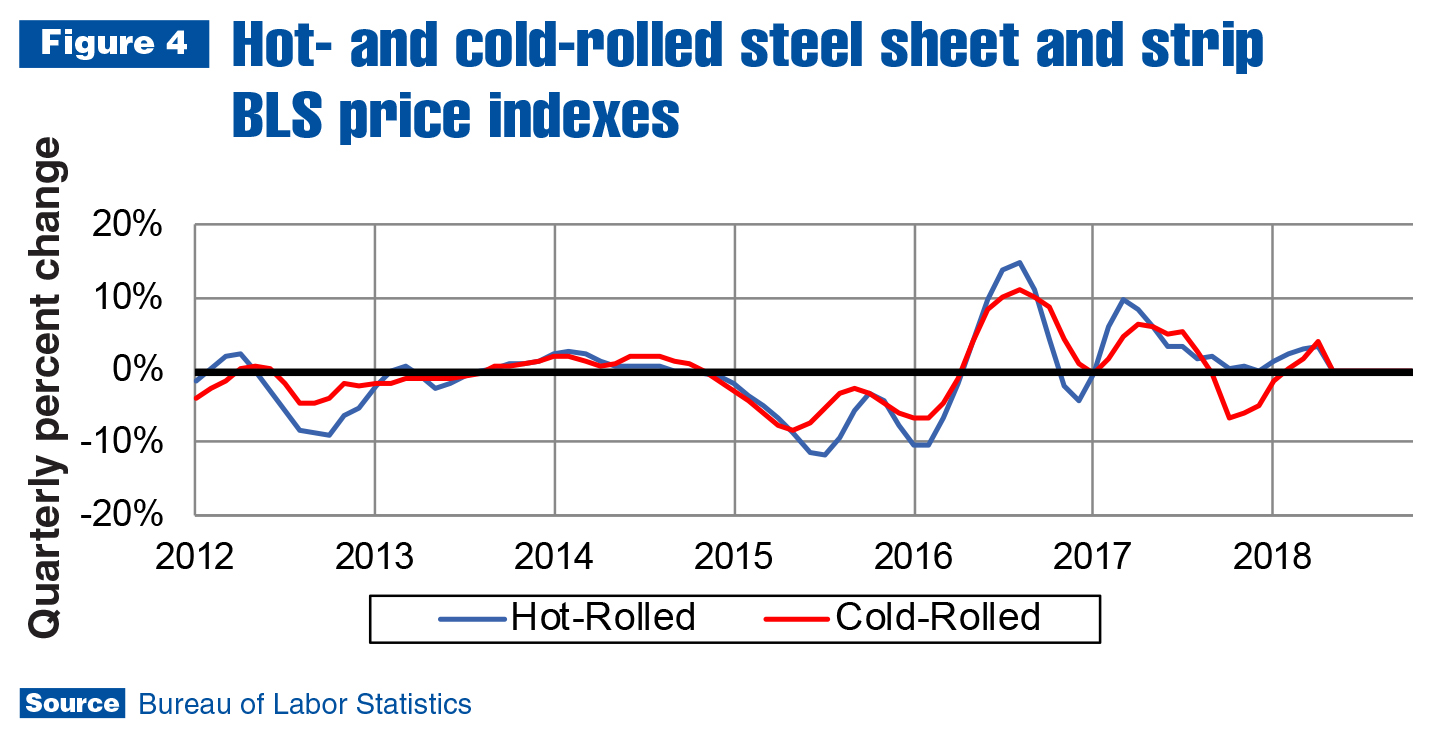
As is shown in Figure 4, hot-rolled steel sheet/strip prices declined throughout 2017 on a quarter-to-quarter basis. This changed in the first quarter as prices started climbing again. In March, the White House’s announcement that tariffs were being considered caused demand to increase as companies became concerned about shortages. That caused prices to rise at an accelerating rate. The same occurred in the market for cold-rolled steel sheet/strip, but at an even faster pace.
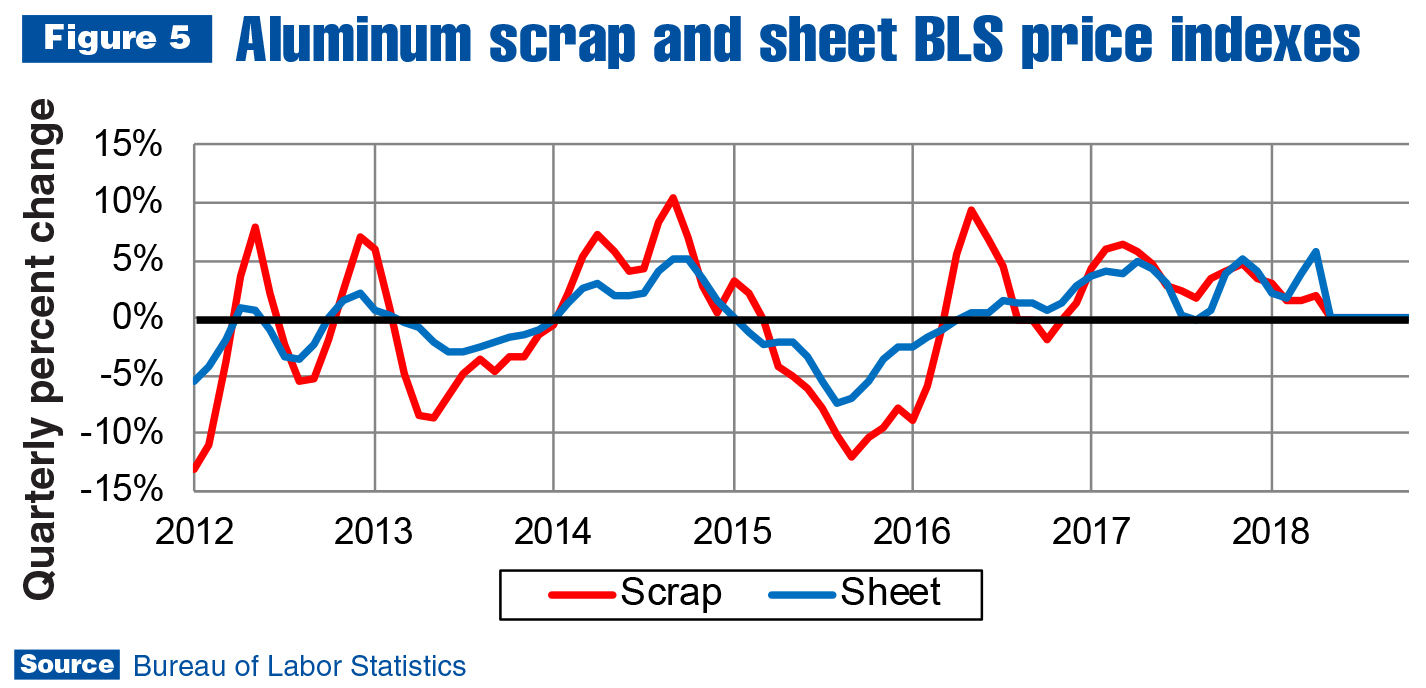
In Figure 5, it’s clear the impact on the market for aluminum sheet was even more pronounced than in steel sheet, despite the lower tariff rate. As aluminum sheet inventory falls, the pace of change will likely intensify and carry over to the market for aluminum scrap.
The price of oil has been rising lately. The most recent surge above $70 per barrel was precipitated by the U.S. backing out of the Iran nuclear deal. There is an international component to this as the United Kingdom, Germany, France, Russia and China were also part of the deal. The U.S. will impose new sanctions on Iran, and European nations have asked to be exempted from them. China will almost certainly ignore the sanctions, and India may, too, refuse to cooperate. Since China and India are two of the largest importers of Iranian oil, sanctions may not have much impact.
The U.S. will likely establish a new record for drill rigs in operation this year. This increase in production is putting downward pressure on the global price of oil, but through the first half of this year, rising demand has had a greater impact on the market. Saudi Arabia and Russia announced they may increase production. The price per barrel is expected to remain near $70 through the third quarter of this year.
Leading indicators
There are numerous indicators of economic activity that tend to reach peaks and troughs in their business cycles ahead of the market for commercial trucks and truck equipment. One is the freight shipments index published by American Trucking Associations (ATA). As of March, the index was accelerating toward a 6 percent annual growth rate, nearing the previous record of 6.2 percent set at the end of 2013. ATA’s index tends to move up or down about six to nine months before truck and equipment sales.
Peaks and troughs generally occur in the housing starts cycle about nine to 12 months before turns in the work truck industry’s sales cycle. As of the first quarter, housing starts are increasing, and the rate of growth is accelerating. This indicates commercial truck and equipment sales will not likely turn down anytime soon.
So, why are NABE Outlook panelists concerned? Why are half of them predicting the next recession will start in the first half of 2020? They are paying attention to financial sector indicators — the yield curve, in particular (depicted in Figure 6). The yield curve is a comparison of two- and 10-year maturity Treasury bills. When the rate paid for 10-year bills falls below the rate paid for two-year bills, it is referred to as an inversion. Since the 1960s, every yield curve inversion has been followed by the start of a recession about one year later.
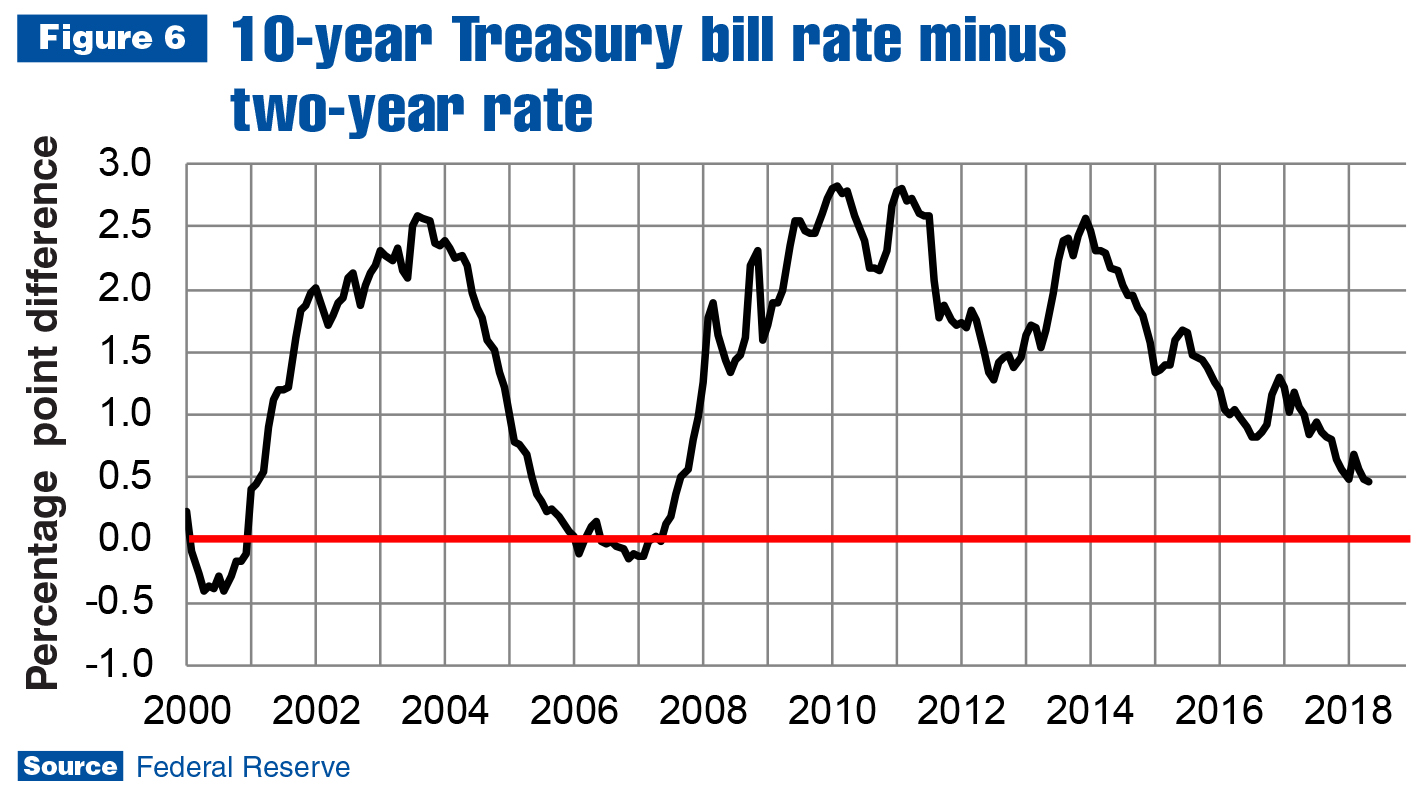
A glance at Figure 6 makes it clear the yield curve is approaching the next inversion. On current trend, it will likely invert in the first half of 2019. There are a number of economic factors that influence interest rates. Some of the more important ones are inflation, the consumer debt to income ratio and the frequency of loan defaults. As of the first quarter, all three are trending in the wrong direction. Federal government debt is also increasing.
What this means to the work truck industry is that sales will likely continue growing throughout 2018 and 2019. The rate of growth may start tapering off in the fourth quarter of this year, and decelerate through 2019. The forecast of recession in 2020 may need to be revised based on how leading indicators trend over the course of the next year.
Note that not all NTEA member companies will reach the approaching cyclical peak at the same time. The construction sector may provide recession risk mitigation this time around as opposed to the risk enhancement it provided during and after the 2007–2009 recession. This is because, recession or not, millennials will keep buying houses — just not as many as otherwise, since we are now in a rising interest rate environment that’s making houses more expensive.
For more industry market data, visit ntea.com/marketdata.