By Steve Latin-Kasper, NTEA Director of Market Data & Research
This article was published in the July 2016 edition of NTEA News.
U.S./Mexico commercial truck chassis sales rose 10 percent in March 2016 as compared to the same month last year, with a cumulative rate of 10.3 percent. In Canada, chassis sales rose 12.3 percent through March. First-quarter growth in both markets exceeded the annual rate for 2015, and surpassed 2016 predictions. IHS Automotive Division anticipates a 0.5-percent uptick for Class 3–8 commercial truck and chassis sales for the U.S. in 2016 and a 3.2-percent increase for Canada. IHS will provide a June update; an upward revision is expected for each market.
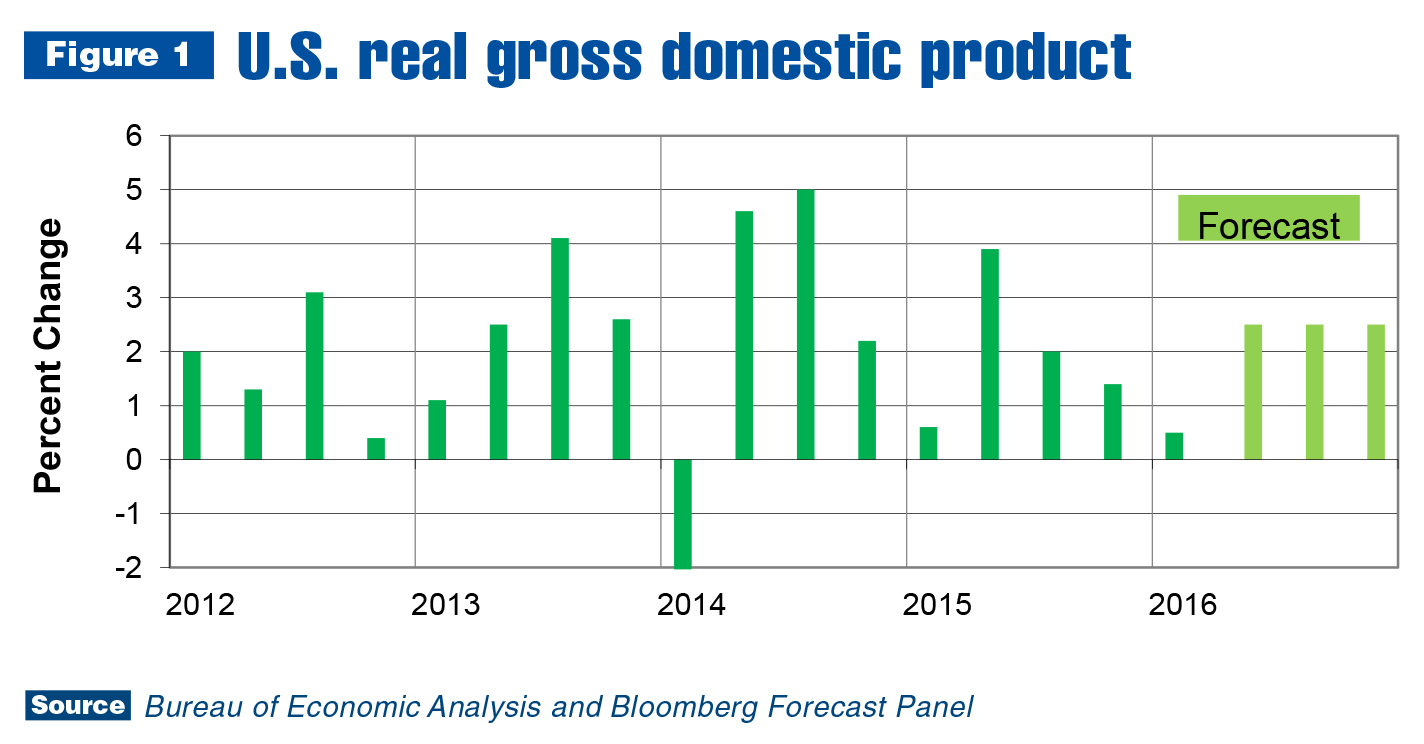
The forecast adjustments are partially due to an improving U.S. economy. Second-quarter U.S. gross domestic product (GDP) projections all suggest gains will outperform the first quarter. This wouldn’t take much as U.S. GDP grew only 0.8 percent in the first quarter. In fact, 0.8 percent was the second estimate of first-quarter GDP — a slight increase from the initial assessment of 0.5 percent. The rise in real gross domestic product from the first to second estimations primarily reflected positive contributions from personal consumption expenditures, residential fixed investment, and state and local government spending.
Consumers seem to be opening their wallets. According to Advance Monthly Sales for Retail and Food Services (published by the U.S. Census Bureau), retail sales grew 1.3 percent in April 2016 as compared to the previous month and 3.0 percent from April 2015. This was the retail sector’s best performance since 2009. Sales of durable goods fared well. Motor vehicle sales were up 3.5 percent, but what really boosted the average was an 8.2-percent increase in building materials. This is good news for the work truck industry.
Unfortunately, not all economic indicators are moving in the same direction. In the first week of June, the Bureau of Labor Statistics reported the U.S. economy created only 38,000 jobs in May — well below expectations. For this reason, the Federal Reserve’s Board of Governors (Fed) will probably not raise interest rates at its June meeting. In December, rates increased for the first time in years, changing expectations about the future price of money. This shift pushed some who might have waited to make an expensive purchase requiring a loan (such as a vehicle or house) into the market sooner than if rates had stayed flat. The second uptick may magnify this change in expectations. However, due to slow job creation in May, this will not likely occur until the Fed’s July meeting.
While interest rates aren’t expected to climb enough to make houses unaffordable for the average American family, swiftly rising home prices might. As the second half of 2016 begins, this is already true in some local markets and may trigger expectations that housing prices will keep escalating. This puts even more pressure on prospective buyers to enter the market now.
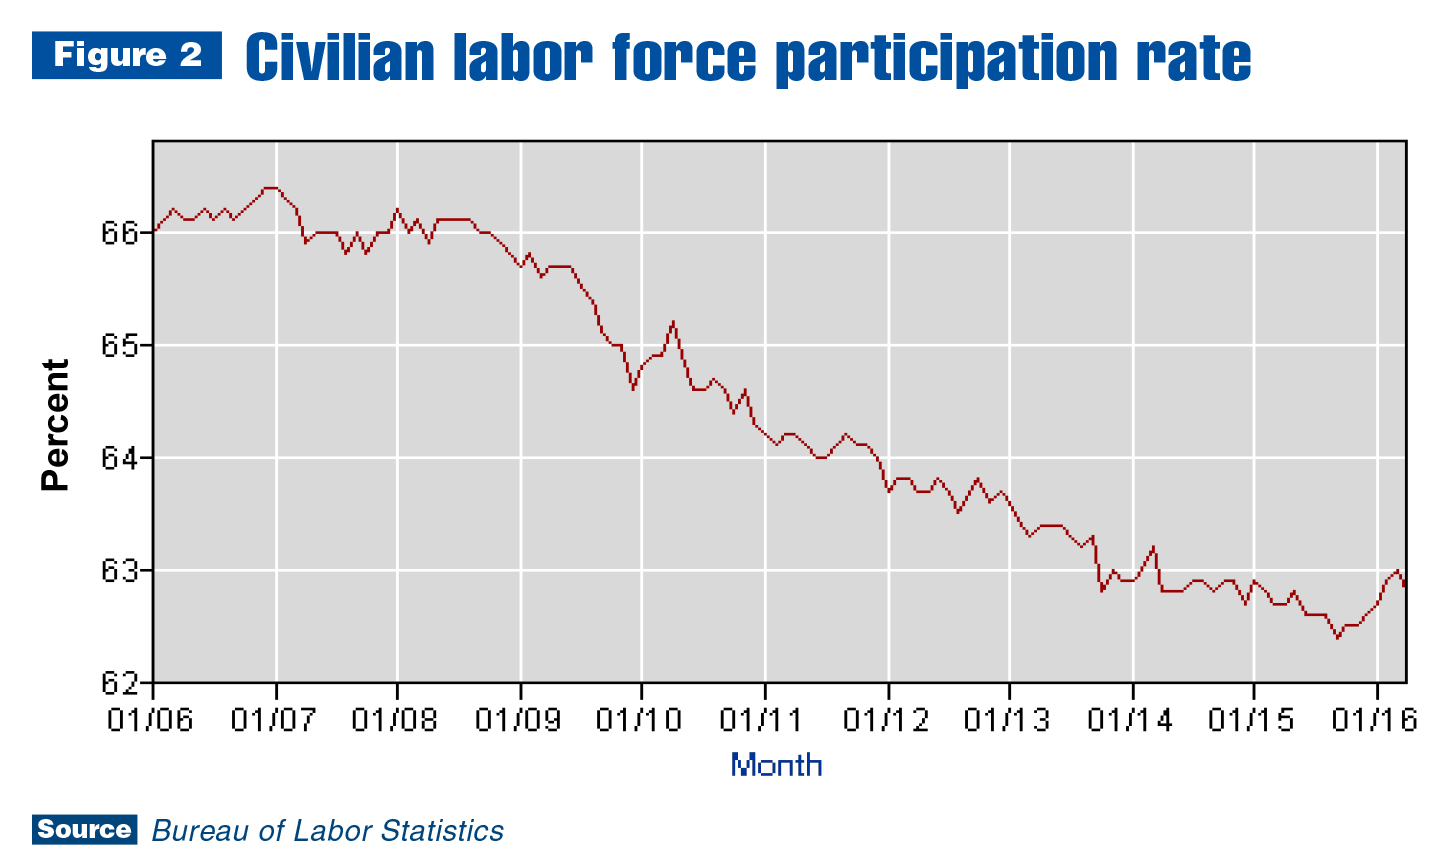
Last but not least, the labor market kept improving in the first quarter. As shown in Figure 2, the labor participation rate slumped after the recession and is now trending upward. This means people who were not previously considered part of the labor force have started looking for jobs again, as the possibility of finding one now seems more realistic.
While the May jobs report wasn’t good, in the first five months of 2016, the U.S. economy added another 748,000 jobs to the 12.3 million new jobs created from 2011–2015. There are relatively few people left in the labor pool at this point. Employers are facing a challenging market as a result, with some bidding up wage rates in response.
Work truck industry
With 10-percent growth registered in March 2016, U.S./Mexico commercial truck chassis sales reached 99,059 units for the first quarter — 9,200 units more than the same period last year and more than twice levels in the first quarter of 2010. There has been substantial growth since the economic recovery began in 2009, and expansion is ongoing. Commercial truck sales forecasts remain positive for this year and next. If the industry holds its first-quarter pace throughout the year, annual sales will reach about 431,000 units — roughly 40,000 units more than 2015 but still well below peak annual sales of 472,200 units registered in 2006.
According to the current 2017 forecast, Class 3–8 sales will remain at the 2016 level, but this is based on a substantial downturn in Class 8. Predictions are for 4.9 percent growth in the Class 3–7 market this year and 1.9 percent growth in 2017. This would push the segment total to roughly 326,000 units in 2017 — 36,000 units below the 2006 peak of 362,764. Therefore, capacity utilization will likely be an issue in the Class 3–7 sector next year. For many NTEA members, this is already the case, so now is the time to plan for additional growth in this market.
The medium-duty segment was the sweet spot in March. In the U.S./Mexico, Class 6 outpaced the rest of the industry with 26.8-percent growth as compared to the same month last year. Classes 4 and 5 were not far behind, with sales increases of about 15 percent. The market behaved differently in Canada, though. Class 4 sales grew the most, at almost 170 percent; Class 5 decreased; and Class 6 was flat. Class 7–8 growth compensated for declines in Classes 2–3.
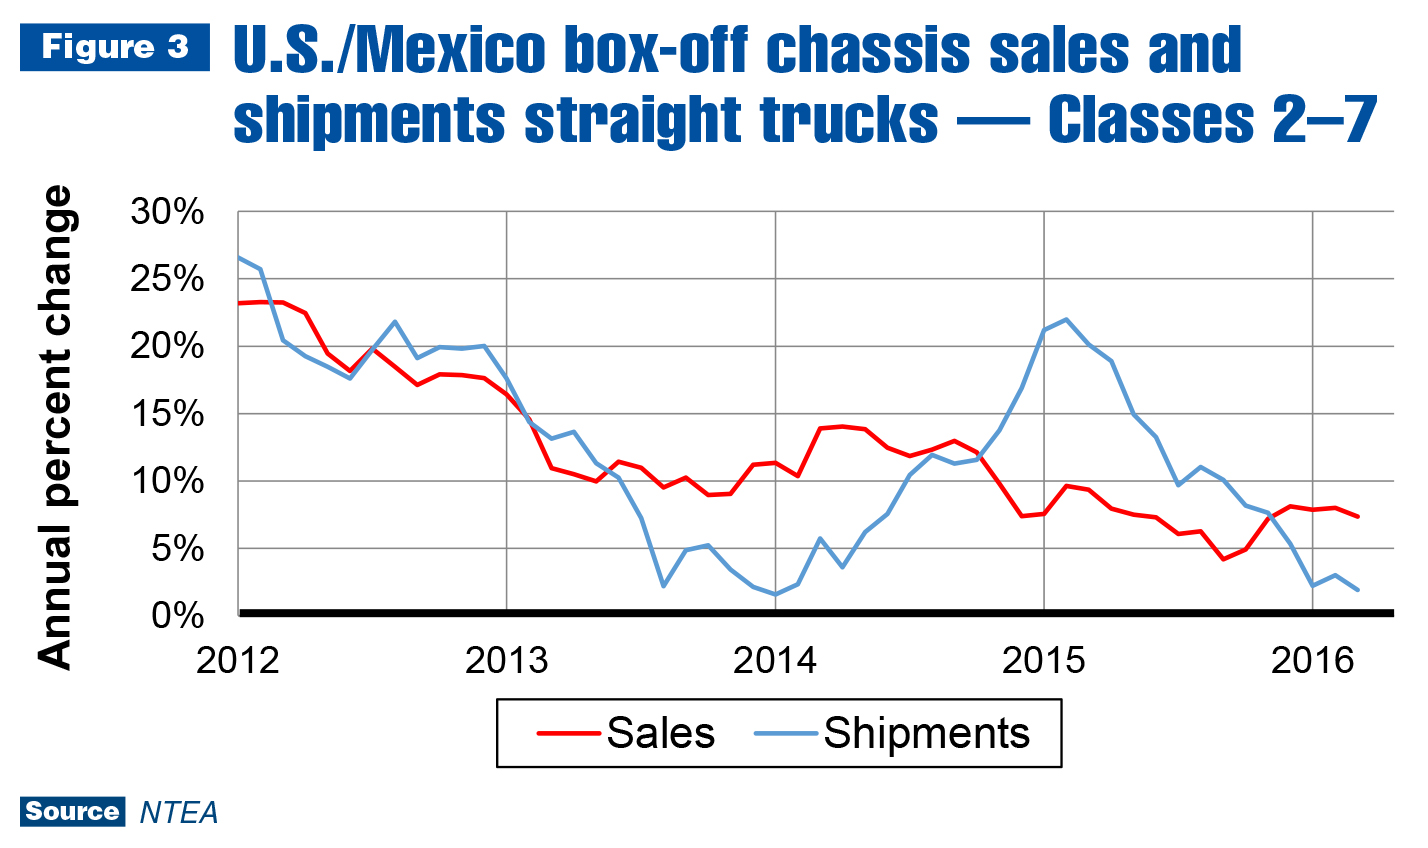
Figure 3 shows the Class 2–7 commercial truck chassis sales growth rate started trending down in the second quarter of 2014, triggering change in OEM expectations, which led to declining shipments. Unfortunately, following historical trend, shipments dropped too much, and an inventory build dwindled away between the fourth quarters of 2014 and 2015. As of the first quarter of 2016, shipments lagged sales, and OEM outlooks were clearly too low. Lead-times
will likely stretch further through the third quarter as it takes time to adjust production schedules.
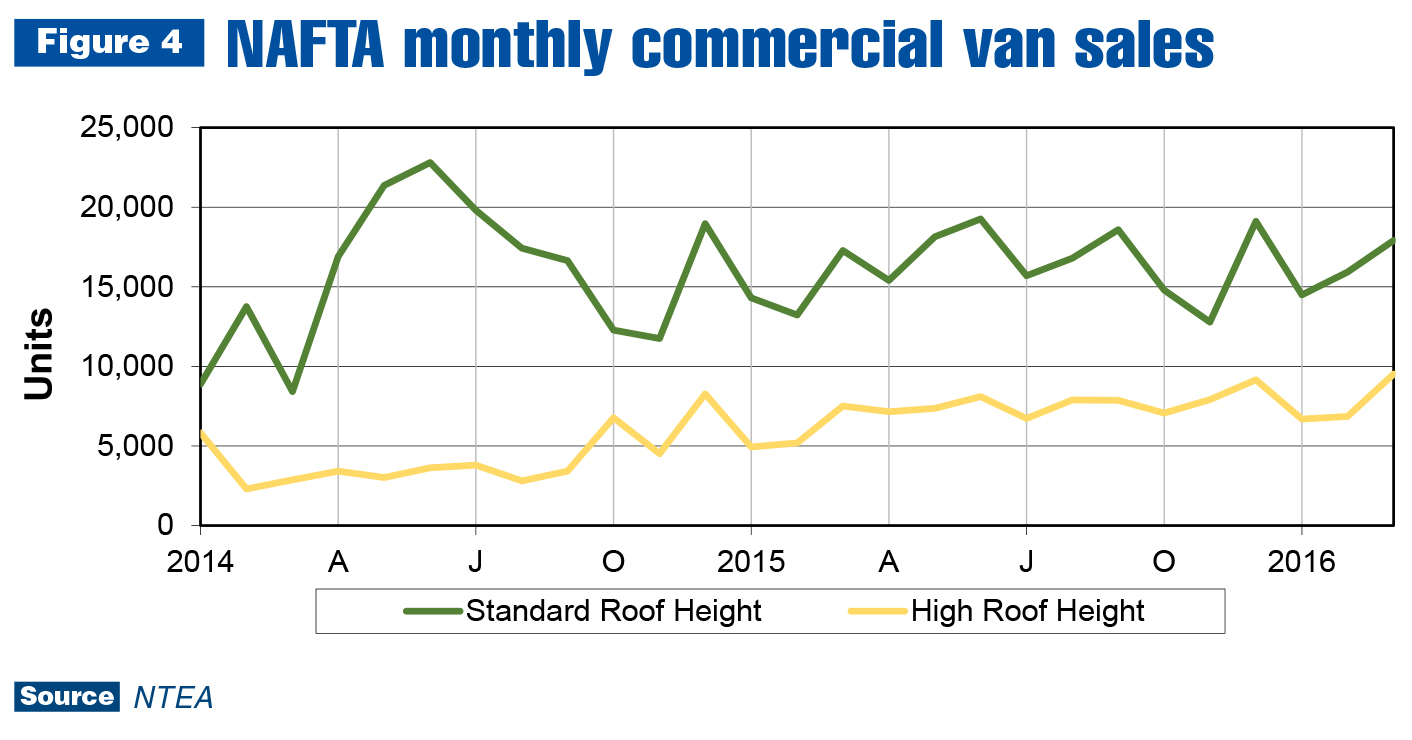
Commercial van sales kept growing in March (see Figure 4). The standard and high-roof height market segments have been trending up since 2013. The graph shows high-roof height sales doubled between the first quarters of 2014 and 2016, growing from roughly 9,900 units to approximately 21,100 units. Standard roof height sales didn’t increase as quickly in percentage terms but grew more in absolute terms. The total was 27,700 units in the first quarter of 2014 and 44,300 units in the same period of 2016 — an increase of about 16,600 units.
Metals and energy prices
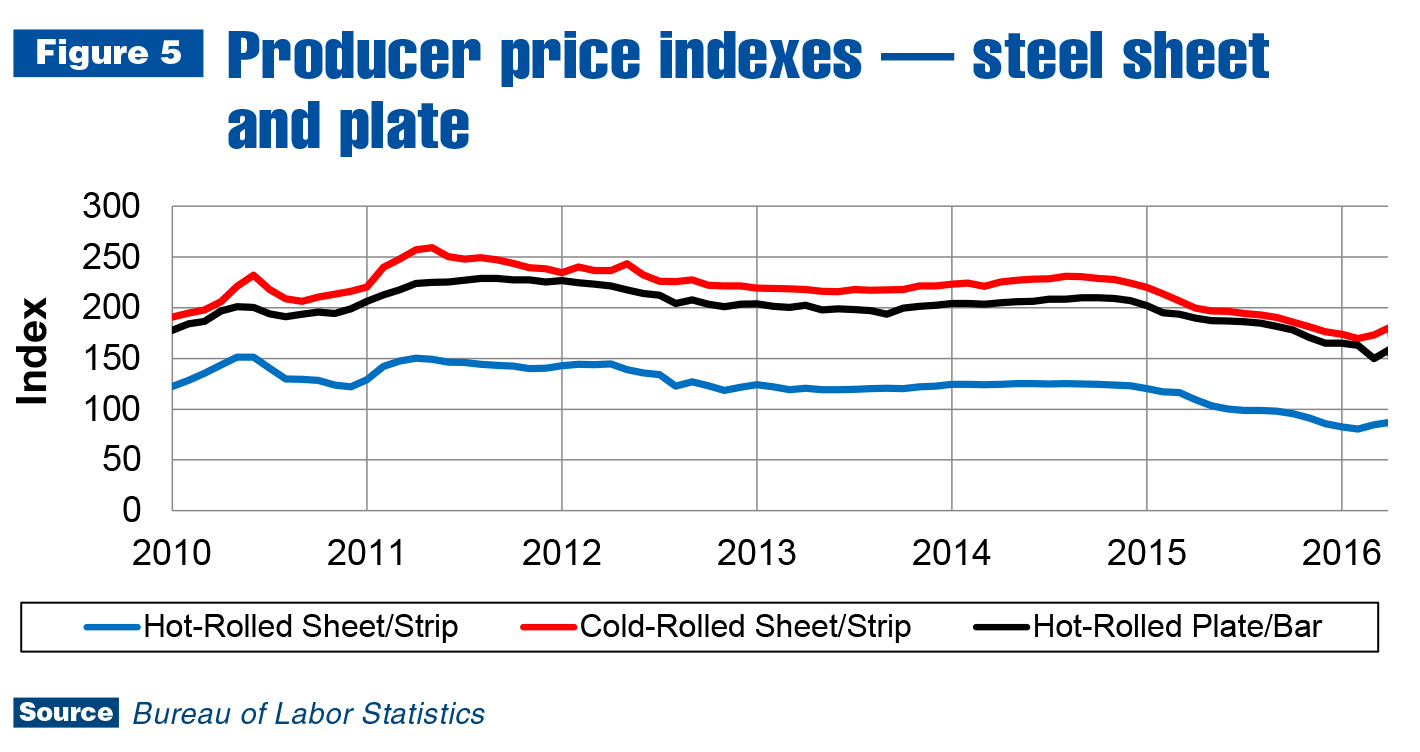
In April, U.S. hot-rolled steel sheet/strip prices were 20.3 percent less than the same month last year. However, in the most recent quarter, prices rose 5.8 percent. This pattern was present in the cold-rolled steel sheet/strip market. Prices were down 9.4 percent for the year in April but up 4.1 percent in the most recent quarter. Hot-rolled plates/bars/shapes prices diverged from this model as prices were still down in the most recent quarter. Figure 5 indicates steel prices have most likely reached a cyclical trough. Prices will probably not rise sharply, but are clearly starting to increase as of the second quarter.
The same is true in the aluminum market. Scrap prices were down 15.3 percent in April 2016 as compared to the same month last year, but up 10.6 percent in the first quarter of 2016. Aluminum sheet prices were down 12.3 percent as compared to April 2015 and up 0.2 percent in the first quarter. Scrap price fluctuations tend to lead product price rising changes. Therefore, aluminum sheet prices will likely continue rising in the second half of 2016.
Regarding supply limits, no decisions were made in an OPEC meeting on June 1. It doesn’t seem to matter much, however, as oil prices have been rising steadily since February. As of June, demand seemed to be converging with supply, resulting in relative market stability at roughly $50 per barrel.
The world’s fastest-growing large economy — India (7.9-percent growth registered in the first quarter) — is working closely with Iran in the oil market. In May, India announced preparations to invest in Iranian off-shore oil projects, and they are discussing a natural gas pipeline which would run through Pakistan.
In summary, global commodities prices seemed to be on the rise as of June. From the work truck industry perspective, this is good and bad. Increasing oil prices lead to higher diesel and gas prices, which cuts into fleet profits and results in reduced truck and equipment expenditures. Rising metals prices have a direct impact on profitability of truck and equipment manufacturers. On the other hand, growing commodity prices will contribute to growth in countries exporting oil, prompting them to order more trucks and equipment. U.S. oil producers will benefit from raised prices as well. In addition, increased commodity prices will make it easier for many less developed economies to pay foreign debts, leading to better lending conditions throughout the global financial sector.
Leading indicators
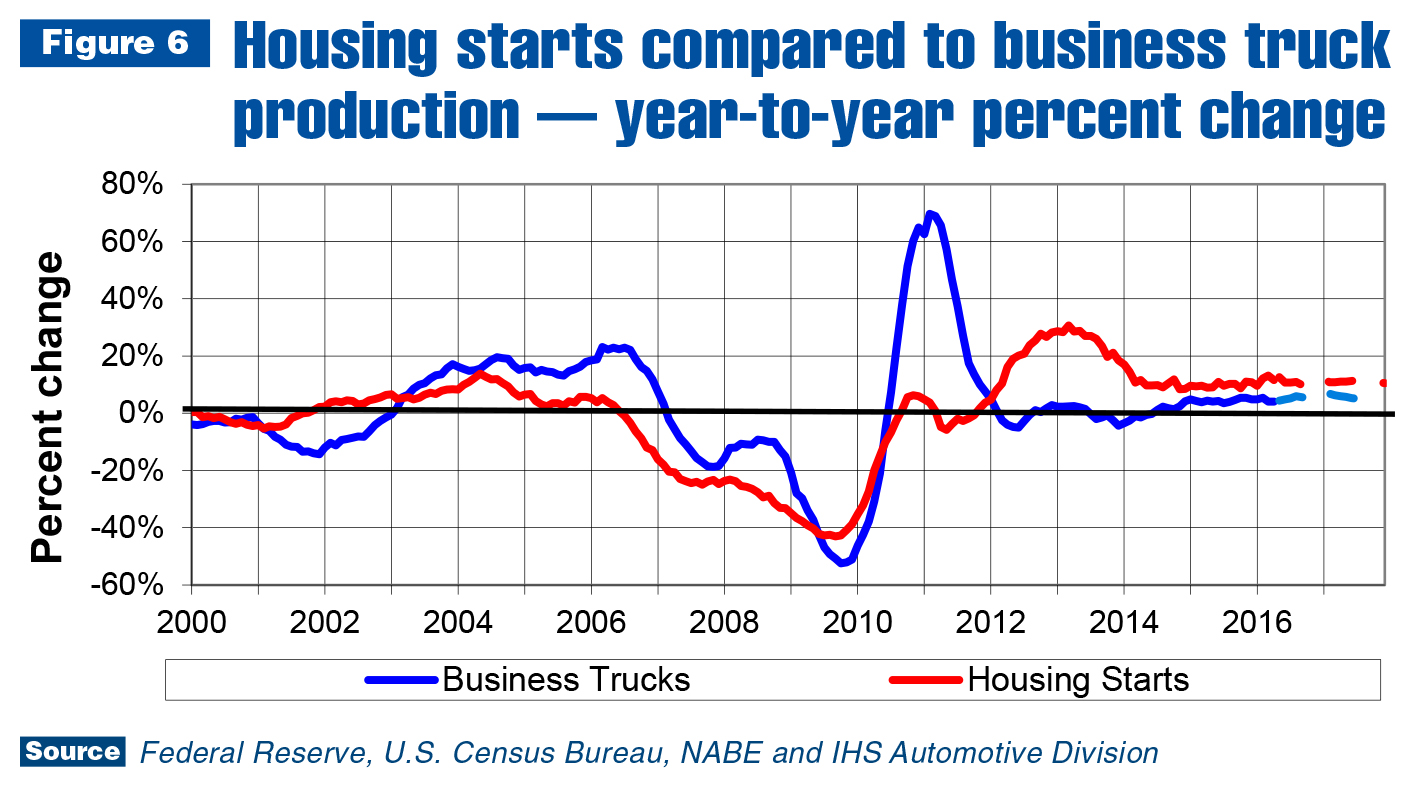
In April, 108,000 U.S. housing starts were recorded — slightly down from the 108,500 registered last year. Cumulatively through April, there were 356,000 housing starts — 10.2 percent higher than the 323,100 housing starts from the same period in 2015 and slightly behind forecast. The current 2016 housing starts forecast in the National Association for Business Economics (NABE) Outlook is 1.24 million — an 11.7-percent uptick as compared to 2015 if it proves accurate.
The NABE forecast predicts 1.37 million housing starts in 2017 — a 10.5-percent increase from the 1.24 million housing starts estimated for 2016. NABE’s panel is not quite as positive about the nonresidential construction industry segment. Business fixed investment is projected to gain 2.5 percent in 2016 and 4 percent in 2017. While the forecast isn’t “irrationally exuberant” (as Alan Greenspan would say), it reveals more growth is expected, not less.
It’s still uncertain if this will be enough to cause the Fed to raise rates in June. Its recent business conditions survey conducted at the end of May indicated growth was slow or flat in six of its 12 districts. While this isn’t exactly good news, and the lackluster May jobs report made it worse, other economic variables may outweigh slow growth concerns.
The U.S. unemployment rate is 4.7 percent — essentially full employment. Businesses across the U.S. want to hire but can’t find qualified applicants. The consumer price index (excluding food and energy) averaged 2.2 percent for the first four months of 2016, exceeding the Fed’s 2-percent target inflation rate. While the labor market can’t be ignored, it’s possible one month’s worth of slow job creation will be outweighed by inflation concerns. If this is the case, the Fed may raise interest rates at its June meeting.
Considering these factors, it’s difficult to conclude U.S. or global growth will accelerate much this year. There’s still too much uncertainty. On the other hand, consumers and businesses have large amounts of cash on hand. U.S. consumers remain the wildcard. If improved confidence leads to a substantial increase in consumer expenditures, that will trigger higher business expenditures. At present, buyers seem content to raise spending slowly.