This article was published in the June 2016 edition of
NTEA News.
U.S. truck market size can be analyzed in many different ways. Counting
the number of trucks on the road is one option. The Department of
Transportation’s Federal Highway Administration (FHA) is the primary public
source of this data, publishing updated vehicle registrations annually in its
Highway Statistics. Data for 2014 was released in February 2016.
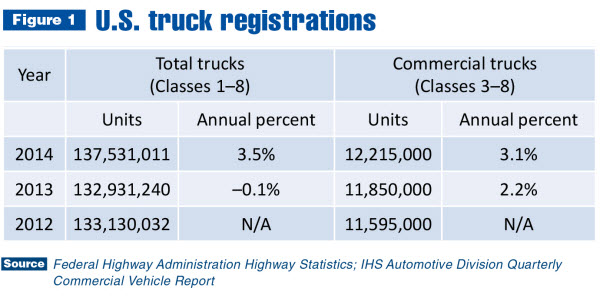
Across all weight classes, FHA reported 137.5 million trucks registered
for use in the U.S. as of 2014 (see Figure 1). According to IHS Automotive
Division, 12.2 million of this total were Class 3–8 trucks used commercially.
Both results rose more than 3 percent from 2013–2014. In 2013, commercial truck
registrations grew at a faster pace than the total. These sources are useful for
tracking different truck market segments.
Highway Statistics
FHA’s Highway Statistics
includes data for trucks, buses and trailers by state, allowing truck and
equipment manufacturers to estimate potential product sales. These figures are
segmented into private and public sector components, making them even more
valuable.
States with the largest populations tend to have the most trucks
registered. While this trend is no surprise, it’s important for NTEA members
doing business with government entities to know there is more to the story. In
Figure 2, the top eight states are segmented by private sector, federal, and
state and local government. The top three states stay the same across all
sections, but it gets interesting thereafter.
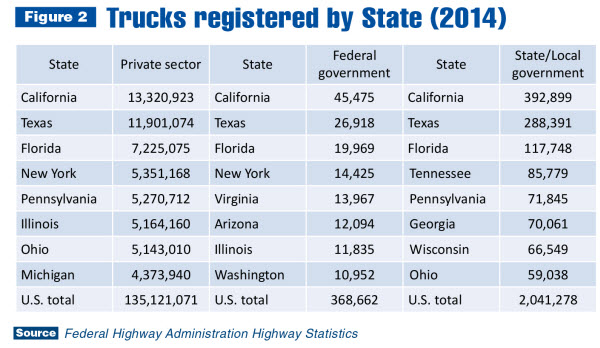
State and local government truck registrations amount to more than five
times as those registered by the federal government. For this
reason, state and local entities should attract more attention from companies
selling products (such as plows to clear highways) than the federal government.
Tennessee and Wisconsin serve as helpful examples of the importance of paying
attention to detail as those two states ranked 16th and 18th, respectively, in
terms of total trucks registered but placed fourth and seventh among state and
local government registrations. FHA’s Highway Statistics segments truck
registrations by type, isolating pickups, sport utility vehicles, vans, farm
trucks, other light trucks and truck-tractors.
In addition, Highway Statistics includes bus and trailer data, with
categories for private, commercial and publicly-owned buses. Within private and
commercial classifications, information is split by type — commercial, school
and other uses. The public category is separated into federal and state/local.
All data is segmented by state. Visit fhwa.dot.gov/policyinformation/statistics.cfm
for full details.
Quarterly Commercial Vehicle Report
IHS
Automotive Division’s Quarterly Commercial Vehicle Report is available to NTEA
members at ntea.com/marketdata. Unlike FHA data, this
study provides registration counts by weight class, as well as statistics on
truck age, application market and other variables updated periodically in
different quarters. For example, registration totals from Figure 1 are included
in the September issue.
IHS’s quarterly analysis focuses on new (as opposed to total)
registrations. This data is similar to sales levels and enables comparison to
NTEA’s monthly updates. New registration data is segmented by manufacturer for
engines and transmissions. Weight class totals are distributed by OEM. Much of
this data is not available anywhere else.