By Steve Latin-Kasper, NTEA Director of Market Data & Research
Meet our experts
This article was published in the November 2019 edition of NTEA News.
Key highlights
- Current forecasts call for the next recession to begin toward the end of 2020 or beginning of 2021.
- Commercial truck industry sales are expected to decline in 2020 at a rate of about 6%.
- State and local government fleets should keep expanding, or at least replacing old trucks, through 2021.
Commercial truck industry sales are expected to decline in 2020 at a rate of about 6% — partially because fleets (especially larger ones) are at or past the peak of their purchasing cycles. Another reason is construction expenditures have already turned down on an annual percent change basis. Many other truck application markets are still growing in 2019, but at decelerating rates.
State and local government is an application market growing at an accelerating rate as of June. Figure 1 shows state/local government equipment expenditures have been increasing since 2012 with a brief slowdown at the end of 2014. The chart makes it clear peaks and troughs in the state/local equipment expenditures cycle occur after turns in the truck production cycle.
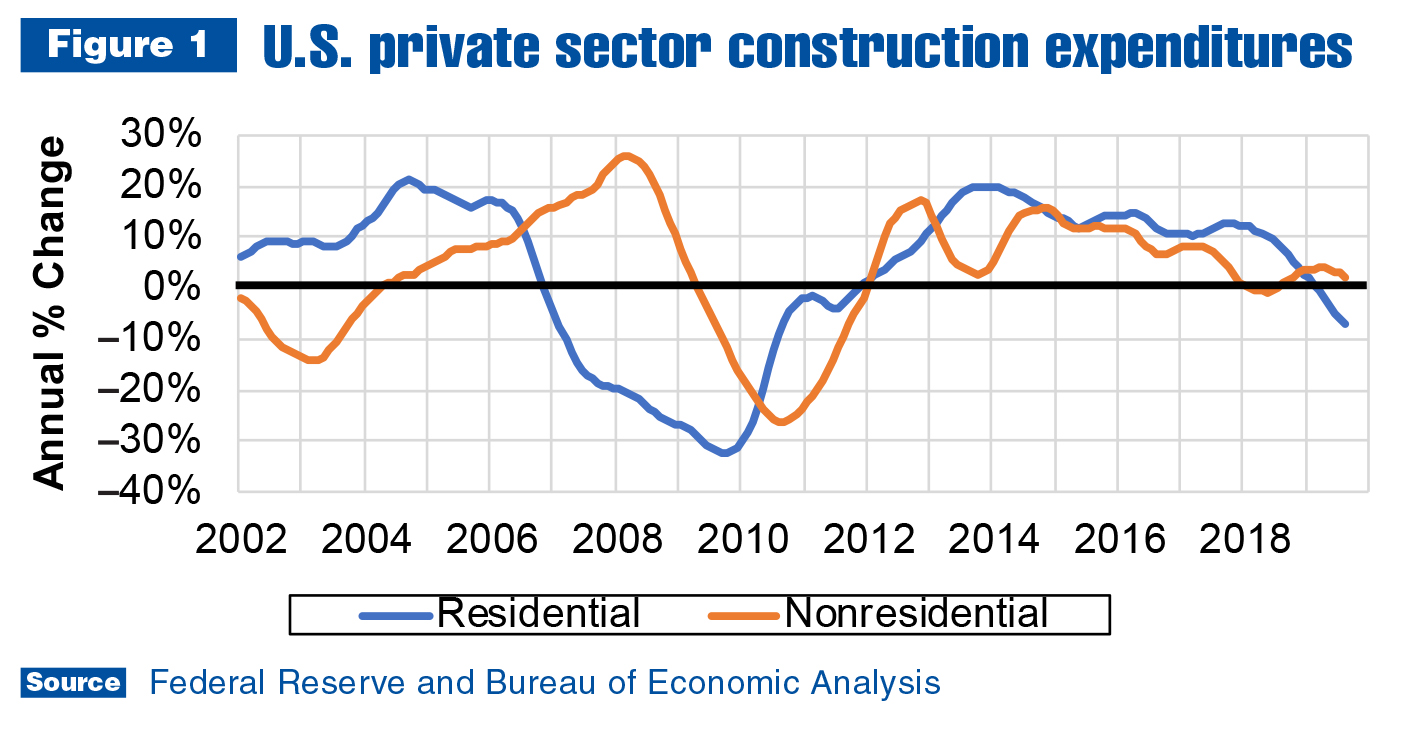
In fact, government expenditures generally lag consumer and capital because they aren’t based on current economic activity. Government expenditures are driven by tax revenues, which rise with incomes and property values. In the past five years, both incomes and property values increased — the latter more than the former. In any economic cycle, tax revenues will continue growing one to two years after a recession starts.
Current forecasts call for the next recession, or at least a period of very slow growth, to begin toward the end of 2020 or start of 2021. State and local government expenditures are expected to continue growing through 2020 as unemployment stays low, which will contribute to further income growth. Property values are also predicted to keep rising, but at a decelerating rate. In other words, tax revenues will likely increase in 2020, and because they lag turns in the economic cycle, in 2021 as well.
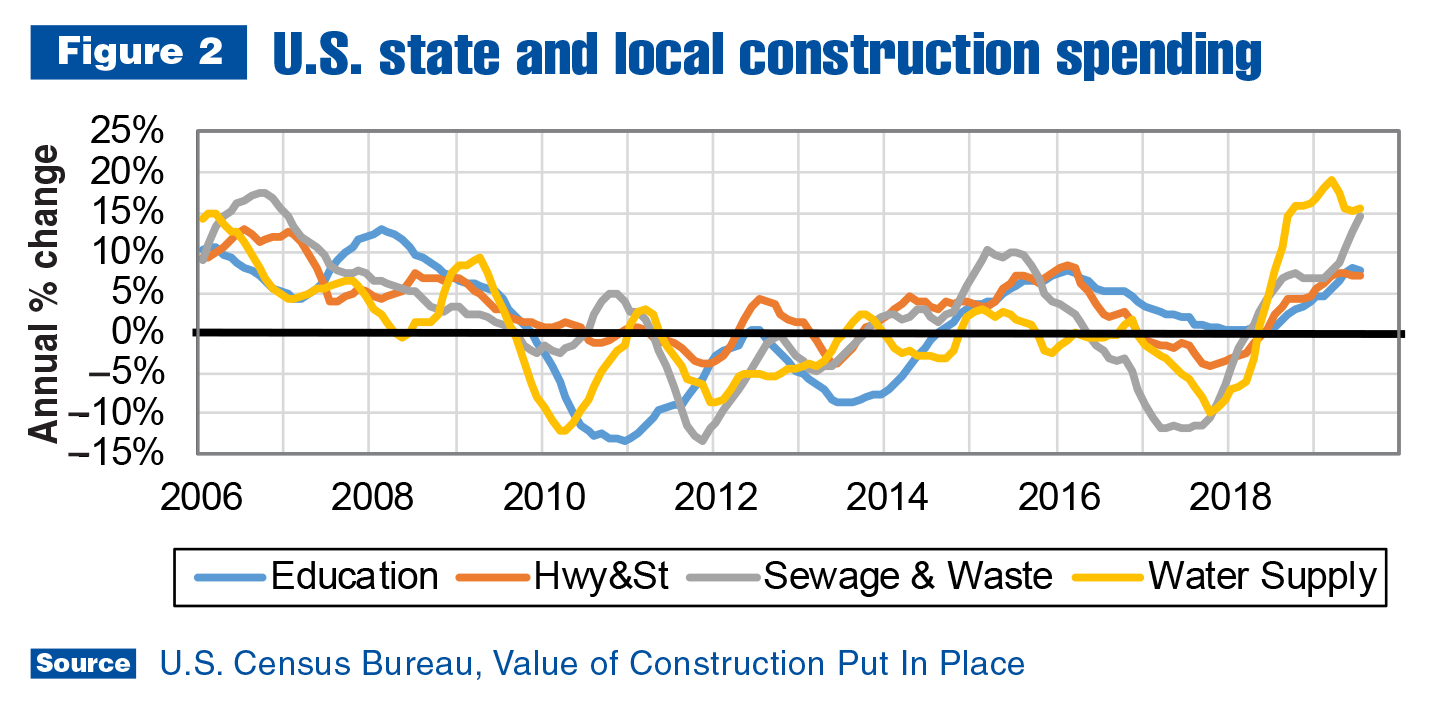
Figure 2 shows segmentation of state and local expenditures on different types of construction. Of the four types of construction typically engaged in by state and local governments, highway and street is the largest, followed by education. As of June, expenditures in both segments were growing at an annual rate of about 7.5%. Substantial gains in sewage and water supply segments pulled the growth rate for total construction expenditures up to around 8.5%.
Such swift growth in sewage and water supply segments since 2018 is not surprising, given how little there was between the end of the 2007–2009 recession and 2018. Many water systems around the country are still in need of repair and/or expansion. Highway and street, and education segments did slightly better from 2014–2018, and are both expected to keep growing through 2021.
Education was the only segment to avoid a downturn in 2017 due to political uncertainty regarding federal matching funds after the 2016 election. This is because millennials’ children started entering kindergarten about five years ago. The number of kids entering the school system is expected to continue rising for about the next five years before stabilizing (good news for bus and bus body manufacturers).
In general, state and local fleets should keep expanding, or at least replacing old trucks, through 2021. One caveat going forward is state/local expenditures could be negatively impacted by uncertainty caused by the 2020 election. It’s not anticipated to be as extreme as 2016 because political leadership on both sides of the aisle seems to recognize the necessity of additional investment in public infrastructure.
For more industry market data, visit ntea.com/marketdata.