By Steve Latin-Kasper, NTEA Director of Market Data & Research
Meet our experts
This article was published in the January 2020 edition of NTEA News.
Key highlights
- The U.S. economic forecast through 2020 calls for more deceleration, but not recession.
- Personal consumption and government expenditures will likely remain primary drivers of U.S. economic growth throughout 2020.
- Truck chassis and equipment sales expectations remain negative for 2020 at about a –5% rate.
After falling in August, U.S./Mexico commercial truck chassis sales bounced back in September 2019 at an 11.5% rate as compared to September 2018. Large gains in cutaway and conventional cab segments more than compensated for declines in strip and low cab-over-engine segments. In the third quarter, sales rose at a 4.5% rate — a slight deceleration from 8% growth in the second quarter — bringing the cumulative rate down to 5%.

In Canada, chassis sales fell 11.8% in September 2019 as compared to September 2018. Almost 20% growth in the conventional segment was overwhelmed by large declines in all three nonconventional sectors. In the third quarter, sales grew 1.2% — a deceleration from the 2.5% posted in the second quarter — which brought the cumulative rate for the year down to 2.4%.
Economy
In the North American economy, second-quarter real (adjusted for inflation) gross domestic product (GDP) growth in the U.S. was 2%. Currently, Bureau of Economic Analysis (BEA) estimates third-quarter growth at 2.1%. In Canada, real GDP growth fell from 3.5% in the second quarter to 1.3% in the third. In Mexico, the estimated real rate of growth dropped from 0.3% in the second quarter to –0.4% in the third.
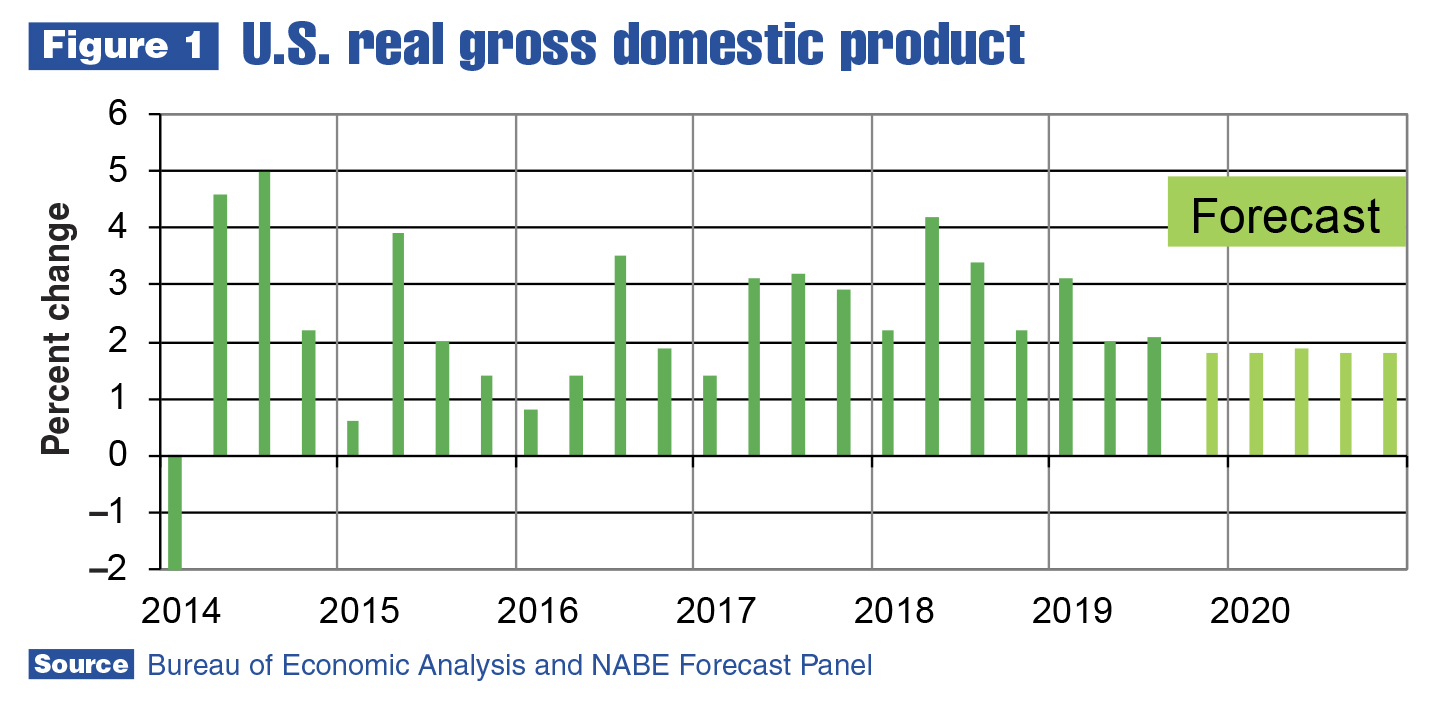
In total, the North American economy continued growing in the third quarter, but at a decelerating rate. This growth pattern was reflected by the work truck industry. As shown in Figure 1, the U.S. forecast through 2020 calls for more deceleration, but not recession. However, Canada and Mexico data is disconcerting, as those economies are clearly slowing faster than the U.S. as of the third quarter.
In the U.S., manufacturing and construction sectors have been declining as of the third quarter. The agricultural sector is also feeling some pain. While personal consumption and government expenditures will likely remain primary drivers of growth throughout 2020, there are potential reasons for concern.
The fraction of personal consumption expenditures made possible by credit cards has been growing. In addition, much of the increase in federal government expenditures was paid for with loans in the form of Treasury bills. In other words, debt is becoming an issue, but the level appears sustainable as of the third quarter.
Some economists are starting to question whether this will remain true, though. The Federal Reserve’s recent lowering of the federal funds rate (to just over 1.5%) caused a decline in the average prime rate of interest to about 4.5%. This is driving greater demand for loans and increasing the money supply. For the past two quarters, the rate of inflation has been stable at about 1.8%. The 2019 drop in oil and fuel prices helped keep inflation low. If food and energy are removed from the calculation, the rate of inflation is about 2.3% as of the third quarter. Clearly, debt and inflation are not at dangerous levels, but merit close attention.
Work truck industry
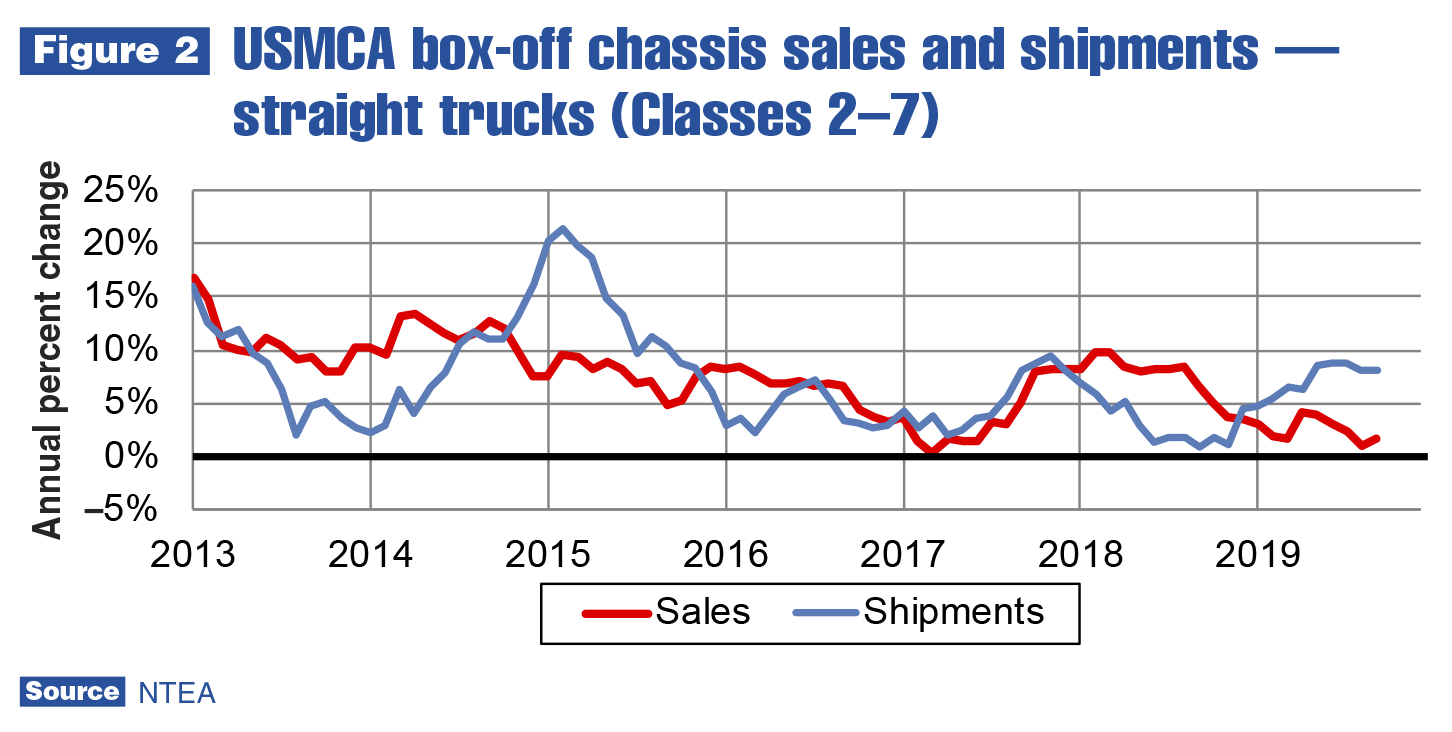
On a month-to-month basis, there was substantial volatility in U.S./Mexico commercial truck chassis sales — but if you focus on same-quarter, previous-year, stability reigned. Conventional, cutaway and low-cab-over-engine sales all rose 6–8% in the third quarter. Strip was the odd segment out, decreasing 4.5%.
Class 4–7 sales rose in a range from 3.3–7.1% in the third quarter. As was the case for most of 2019, Classes 2 and 8 outpaced the rest of the industry. Class 2 sales increased 18% in the third quarter, an acceleration from the 13.8% gain registered in the second. Class 8 sales climbed 22.9% in the third quarter, a slight acceleration from the 22.8% registered in the second. Class 3 was the only segment to register a sales decline in the third quarter, at a 16.4% rate — an acceleration from the 5.2% drop in the second quarter.
Class 8 sales will likely increase again in the fourth quarter of 2019, but the rate of growth is not expected to accelerate. For the year through September, Class 8 sales totaled 48,592 units — a bit behind the 2006 level of 51,608 units. In 2006, as the result of a pre-buy in response to emissions regulation changes, quarterly sales reached a record 18,650 units in the fourth quarter.
In the third quarter of 2019, 18,295 Class 8 units were sold — primarily due to the 7,109-unit monthly record set in September. To grow at 22.9% again in the fourth quarter, sales would have to reach almost 21,000 units (7,000 per month). This would overshadow the quarterly record established in the fourth quarter of 2006. It isn’t likely to happen, but another 18,000+ quarter is probable, which will keep the heavy-duty segment busy.
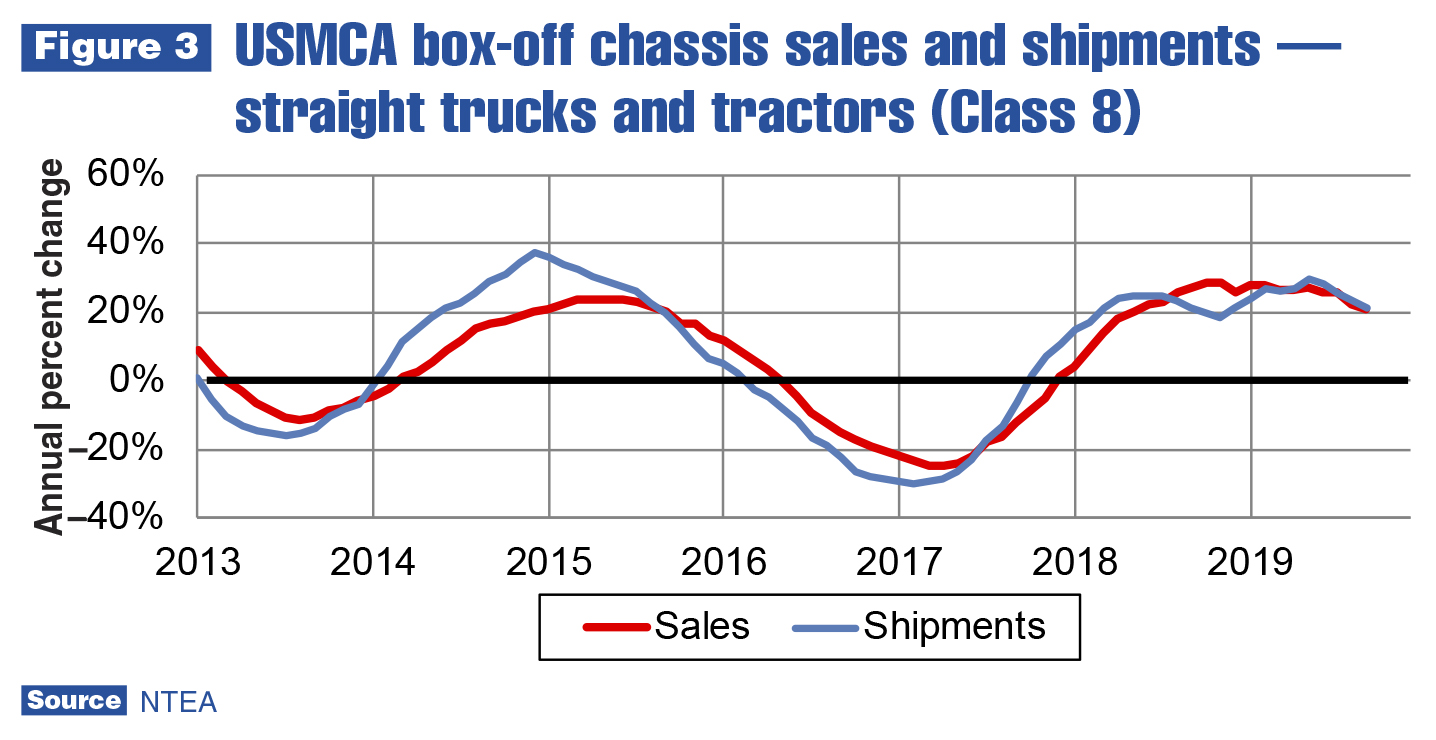
Deceleration is ongoing in the tractor segment. The growth rate peaked in the first quarter of 2019 at 31.2%, before falling to 20.7% in the second and 9.8% in the third. The rate of growth will almost certainly fall again in the fourth quarter.
In the third quarter, commercial van (Classes 1–3) became the fastest growing industry segment. Sales increased at a 27.7% rate — a substantial acceleration from the 7.4% jump in the second quarter. The majority of growth was in the high roof-height segment.
In Canada, commercial truck chassis sales rose at a 1.2% rate in the third quarter, mirroring the 1.3% climb in the larger economy. This was a deceleration from 2.5% growth in the second quarter. Gains in conventional and strip segments slightly outpaced declines in the low cab-over-engine and cutaway segments. Increases in Classes 2, 5, 7 and 8 were slightly higher than losses in Classes 3, 4 and 6. Tractor sales decelerated at about the same rate as in the U.S./Mexico market. Commercial van sales growth accelerated in the third quarter, but more slowly than in U.S./Mexico.
Metals and energy prices
As shown in Figure 4, steel prices have been trending down since the fourth quarter of 2018. For the year through September, the price of hot-rolled steel sheet/strip has fallen 19.5%. In the last three months, though, the rate of decline decelerated substantially to 4.7%.
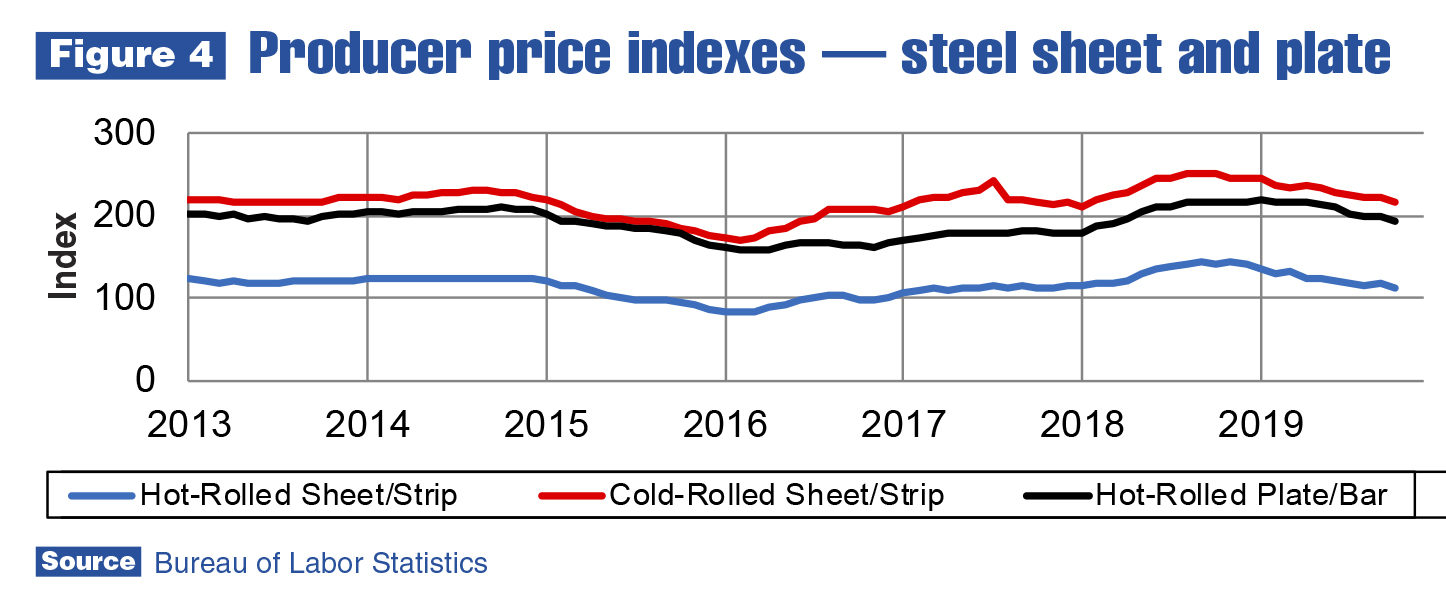
This trend also appears in cold-rolled sheet/strip and hot-rolled plates/bars/shapes markets. Cold-rolled sheet/strip prices dropped 13% through September, but only 3.2% in the past quarter. Hot-rolled plates/bars/shapes prices fell 11.4% for the year through September, and 5.4% since August.
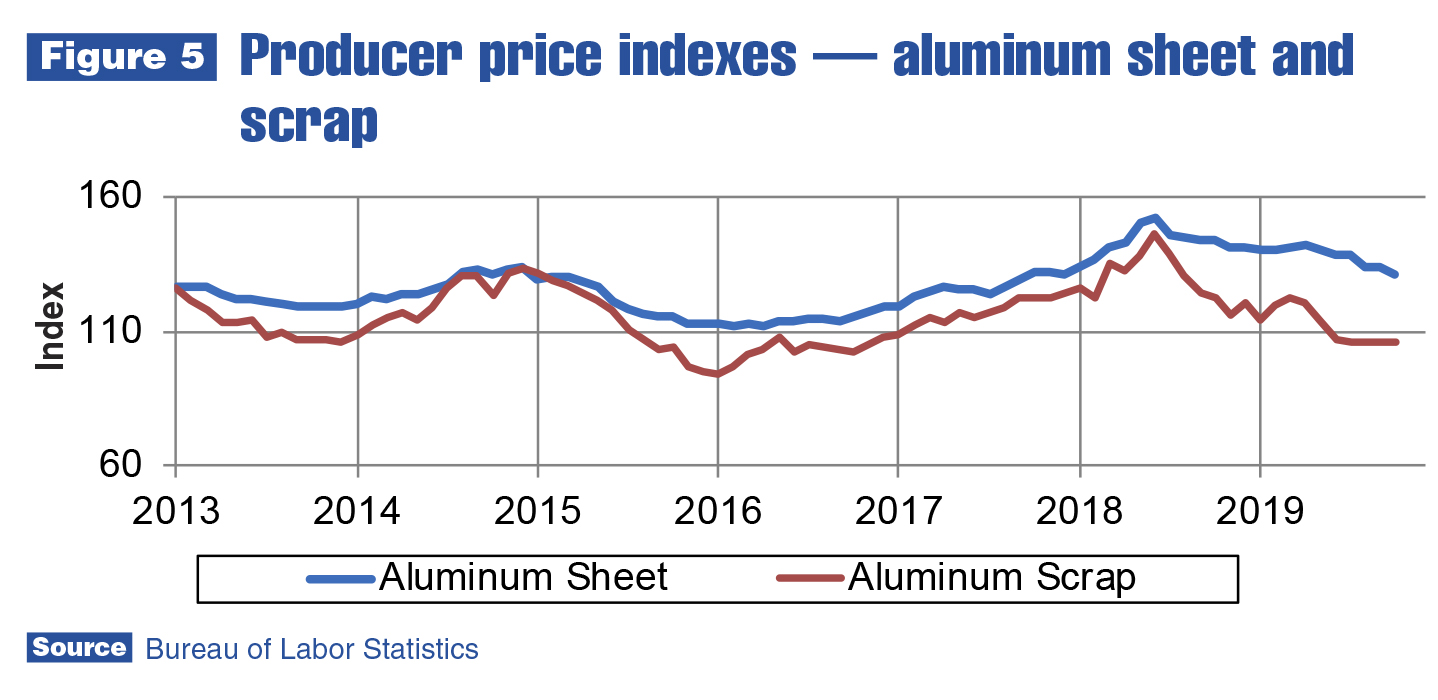
In the aluminum sheet market, prices have decreased 8.8% since the beginning of the year, and 4.9% in the most recent quarter. Aluminum prices started falling in the second quarter of 2018, and appear to be approaching a period of stabilization. Scrap prices tend to stabilize prior to sheet prices, as reflected in Figure 5. Sheet prices will likely continue declining through the first quarter of 2020, but then may level off and stabilize until the global economy starts growing at a faster rate.
In the oil industry, prices have been less volatile in recent months. As of the first week of December, the Brent spot price per barrel was $63. There are two factors that will likely influence the price in the near future. The first involves the OPEC agreement reached earlier in 2019. Some members of OPEC are producing/selling more oil than agreed upon, which has helped keep the price fairly stable, when the intent of the agreement was to put upward pressure on prices. It’s been reported Saudi Arabia is considering flooding the market in an attempt to bring the rest of OPEC back in line. Should this occur, prices will decline in the short-run; however, it’s unlikely Saudi Arabia will have to make that move.
The second factor is current anti-government protests in Iraq. Geopolitical analysts have speculated if protester demands are not met, they could start damaging oil production facilities as a negotiation tactic. If this happens, the upward impact on price will likely outweigh any action taken by Saudi Arabia.
Leading indicators
The two most recent cycles of durable goods (including consumer and capital goods) orders, shipments and inventories are shown in Figure 6. Their relationship is clear — orders reach turning points in the cycle before shipments, and inventories tend to lag substantially. When the inventory cycle intersects the orders/shipments cycle, it signals the next trough is coming. Lead time provided has not been consistent from one cycle to the next, but knowing the next trough is on the way is helpful.
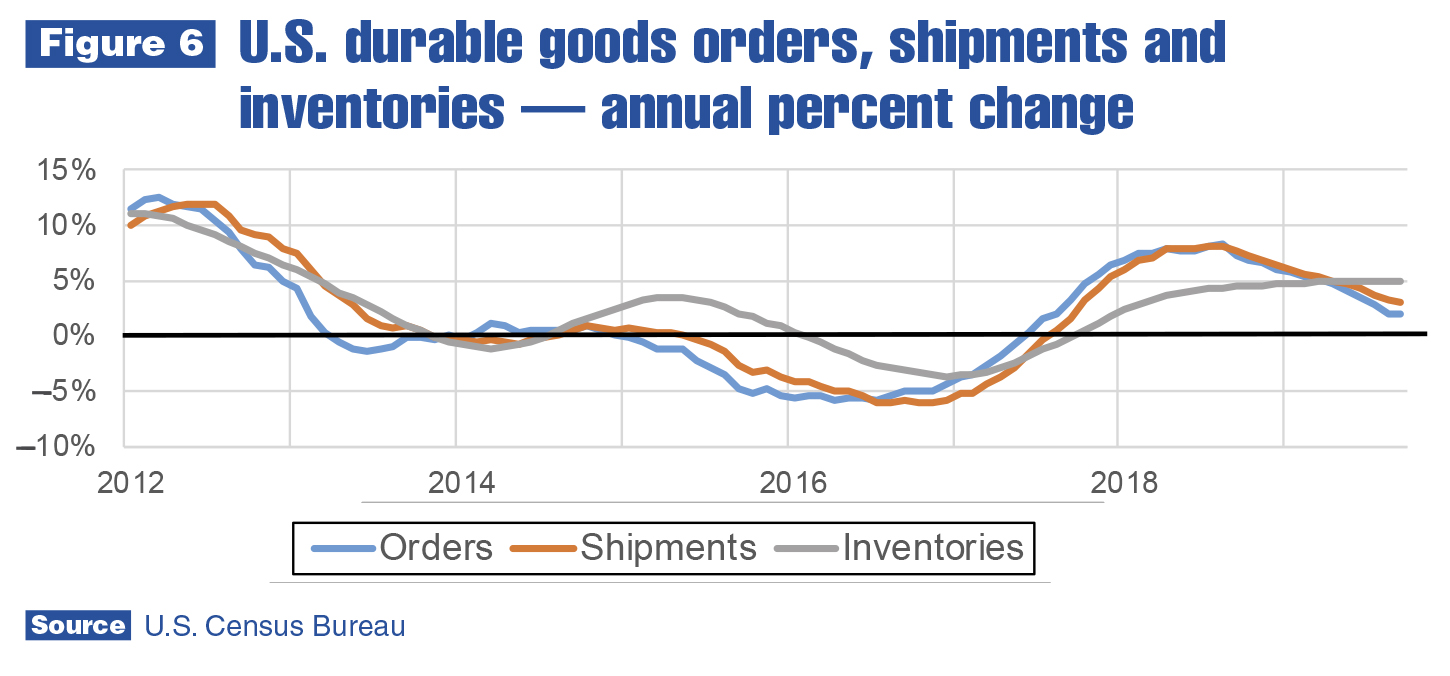
Figure 6 shows durable goods shipments and orders peaked in 2012. Following a recession, the first purchases consumers and businesses make involve items they stopped buying when the recession started — namely, durable goods, which typically last five to 10 years. After 2012, there were many who didn’t need to buy durable goods for a while — but new jobs were still being created, and the newly employed bought durable goods. However, the rate of growth was already decelerating.
Labor market dynamics will continue to have an impact on durable goods sales growth deceleration. The net change in U.S. payroll employment went from about 1 million in 2010 to roughly 3 million in 2014. That was clearly the peak year for job creation in this economic expansion. The net change in payroll employment has been trending down since. In 2019, payroll job creation will be around 2 million — 1 million less compared to 2014. This means 1 million less new hires contributing to durable goods expenditures.
In this phase of the larger economic cycle, construction is heading down along with durable goods. The same long period of deceleration leading to an actual decline occurred in the construction industry, as shown in Figure 7. The residential segment is much larger than nonresidential, which means total construction expenditures are already dropping compared to 2018. Nonresidential expenditures were influenced by the capital expenditures downturn in 2016, and recovered in 2017. Now, they are clearly decelerating again along with the residential segment, and will likely contribute to the decline of total construction expenditures in 2020.
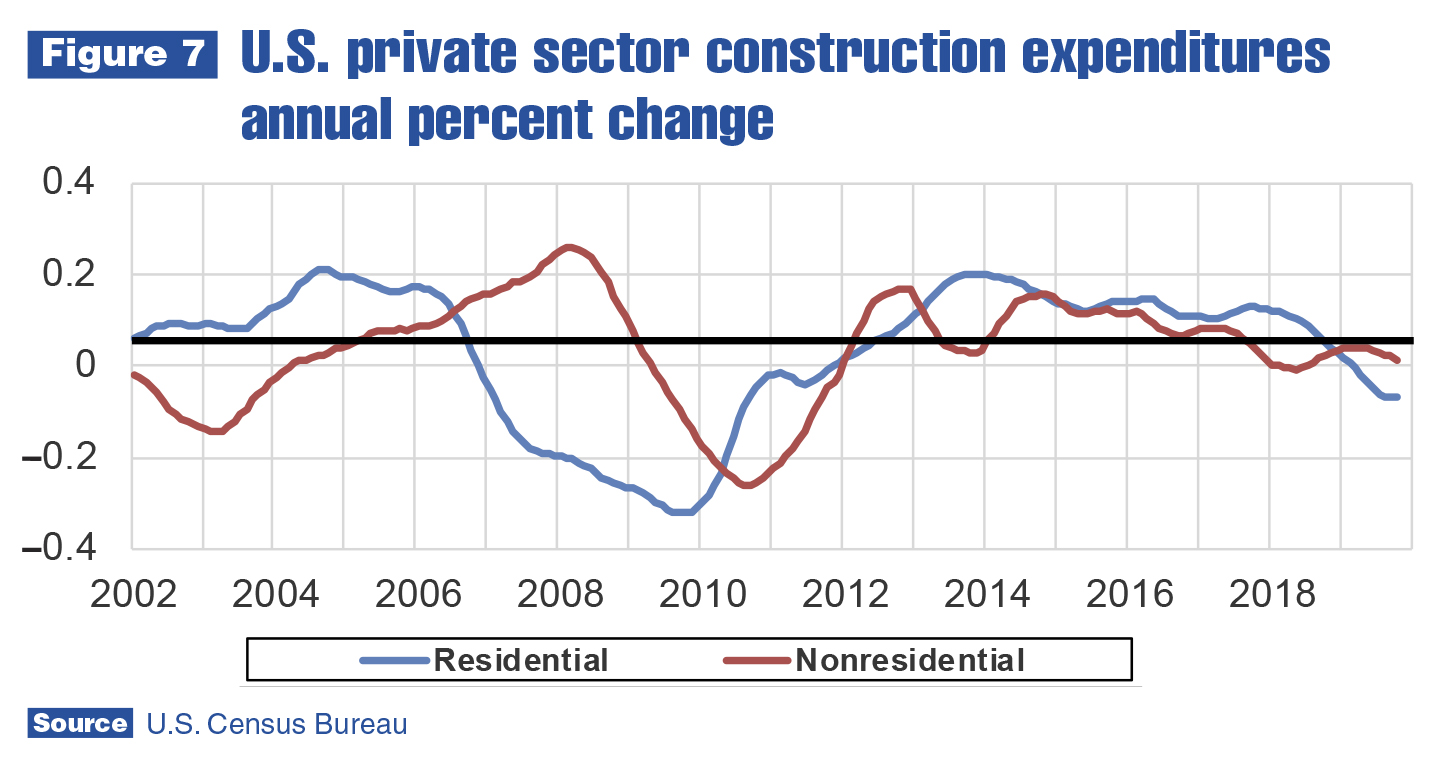
In 2020, nonresidential expenditures will likely follow the residential trend. In other words, an actual decline is probable, which isn’t great news for the U.S. economy or work truck industry. The forecast for chassis and equipment sales remains negative for 2020 at about a –5% rate, but the latest IHS Markit forecast update indicates negative risk factors outweigh positive, and the sales decline could be as much as 11–12%.
For more industry market data, visit ntea.com/marketdata.