By: Steve Latin-Kasper, NTEA Director of Market Data & Research
This article was published in the January 2019 edition of NTEA News.
Key highlights
- Economists are pointing to debt as the most likely driver of the next recession.
- Demand for oil is likely to increase substantially between now and 2025 as the global population and economy grow.
- Commercial truck and truck equipment sales are expected to keep growing in 2019, but at a slower rate than in 2018.
U.S. economy
U.S./Mexico commercial truck chassis sales growth accelerated to 6.4 percent in the third quarter of 2018, as compared to the third quarter of 2017. This was a substantial increase from 1.3 percent growth in the second quarter, pushing the cumulative growth rate up to 4.7 percent. Sales increased 18.4 percent in Canada, causing the cumulative growth rate to climb to 6.2 percent.

The U.S. economy also continued growing in the third quarter. Bureau of Economic Analysis published its second estimate of third-quarter gross domestic product (GDP) growth in November, and there was no change from the first estimate of 3.5 percent. While this indicates the economy slowed from the 4.2 percent growth rate registered in the second quarter, it’s the best two consecutive quarters of growth since 2014 (see Figure 1).
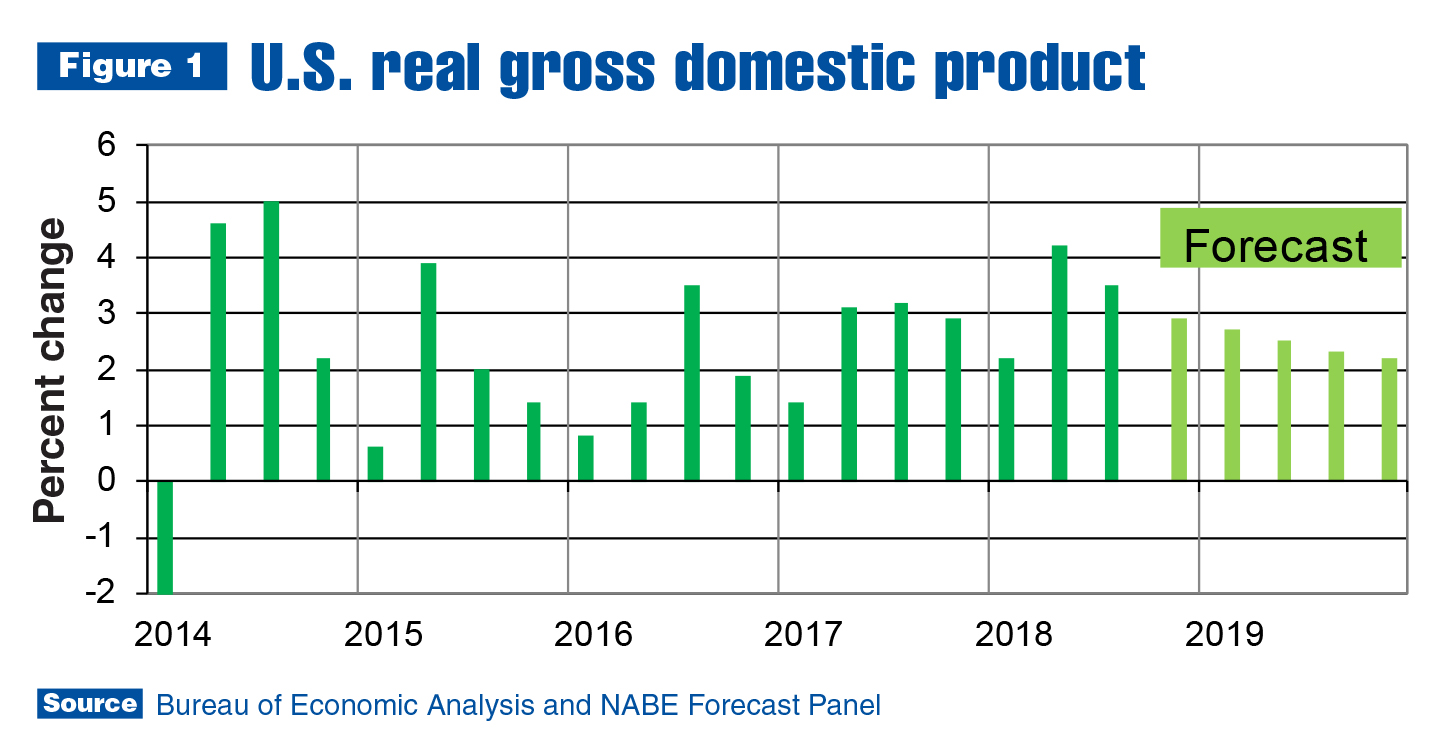
Figure 1 shows despite the recent surge, the U.S. GDP growth rate has been trending down since 2014, which is not surprising. As of 2014, the current economic expansion, which started in June 2009, was already about six years old. If the economy continues growing through the third quarter of 2019, it will break the record for the longest expansion (1991–2001).
Economists on the National Association for Business Economics (NABE) Outlook panel expect the downward trend to continue. Their 2019 consensus forecast is for a 2.5 percent U.S. GDP growth rate — slightly lower than the 2.8 percent anticipated for 2018 and 2.6 percent registered in 2016. Some panel members are predicting recession in 2020, but that isn’t the consensus.
Economists are pointing to debt as the most likely driver of the next recession. Federal Reserve Chairman Powell mentioned the high level of corporate borrowing at the press conference following the Fed’s meeting in November. Total U.S. corporate debt as of the first quarter of 2018 reached a new peak of $29.6 trillion in October. As a percentage of U.S. GDP, it fell just below the record set in the fourth quarter of 2017. Historically, the peak of corporate debt as a percentage of GDP is followed by a recession. We should soon find out if the fourth quarter of 2017 was the peak.
Consumer debt in the form of mortgages is also a potential concern. The average debt-to-income ratio for mortgages insured by Federal Housing Administration, which accounts for about one-fifth of the total, reached a new record in November 2018. Total credit, including student and auto loans, is higher than its pre-recession peak as of November. That said, foreclosures remain at normal levels and most economists don’t consider debt levels too high as of the fourth quarter of this year. However, there is more downside risk than upside in the U.S. financial sector
entering 2019.
Work truck industry
In the U.S./Mexico light- and medium-duty commercial truck chassis market, sales continued growing more than 5 percent in the third quarter of 2018 as compared to the third quarter of 2017. Shipments, though, were practically flat. As the shipments growth rate fell behind sales, lead-times stretched further.
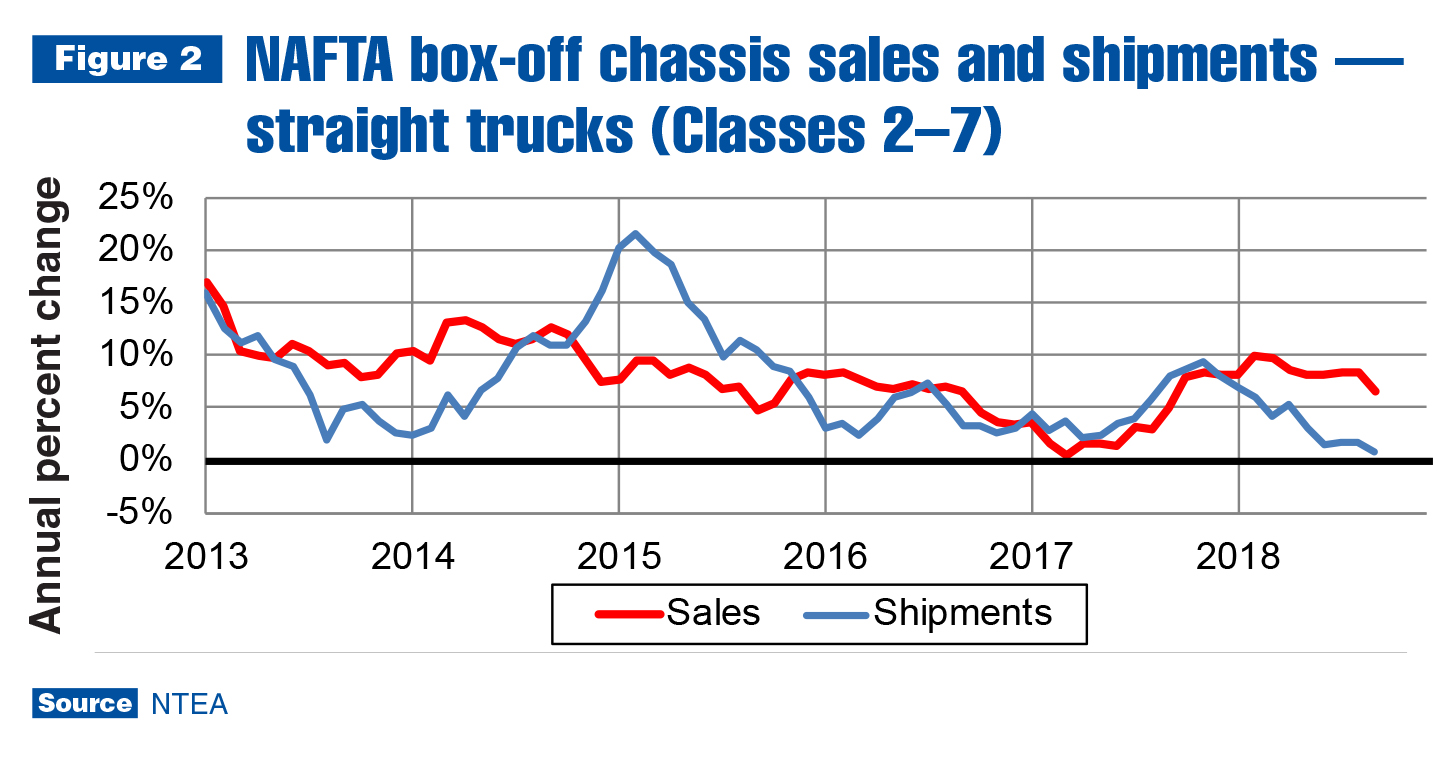
Class 2–7, as depicted in Figure 2, is a sizable chunk of the industry and needs to be segmented to explain how changes in shipments are related to shifts in sales. Figure 3 shows through the first three quarters of 2018, shipments were greater than sales in every weight class, except Class 7. So, why are other lead-times stretched? Call it the December effect. Figure 3 illustrates in Classes 3, 5 and 6, the increase in shipments relative to sales from January through September wasn’t large enough to compensate for large disparities in December 2017.
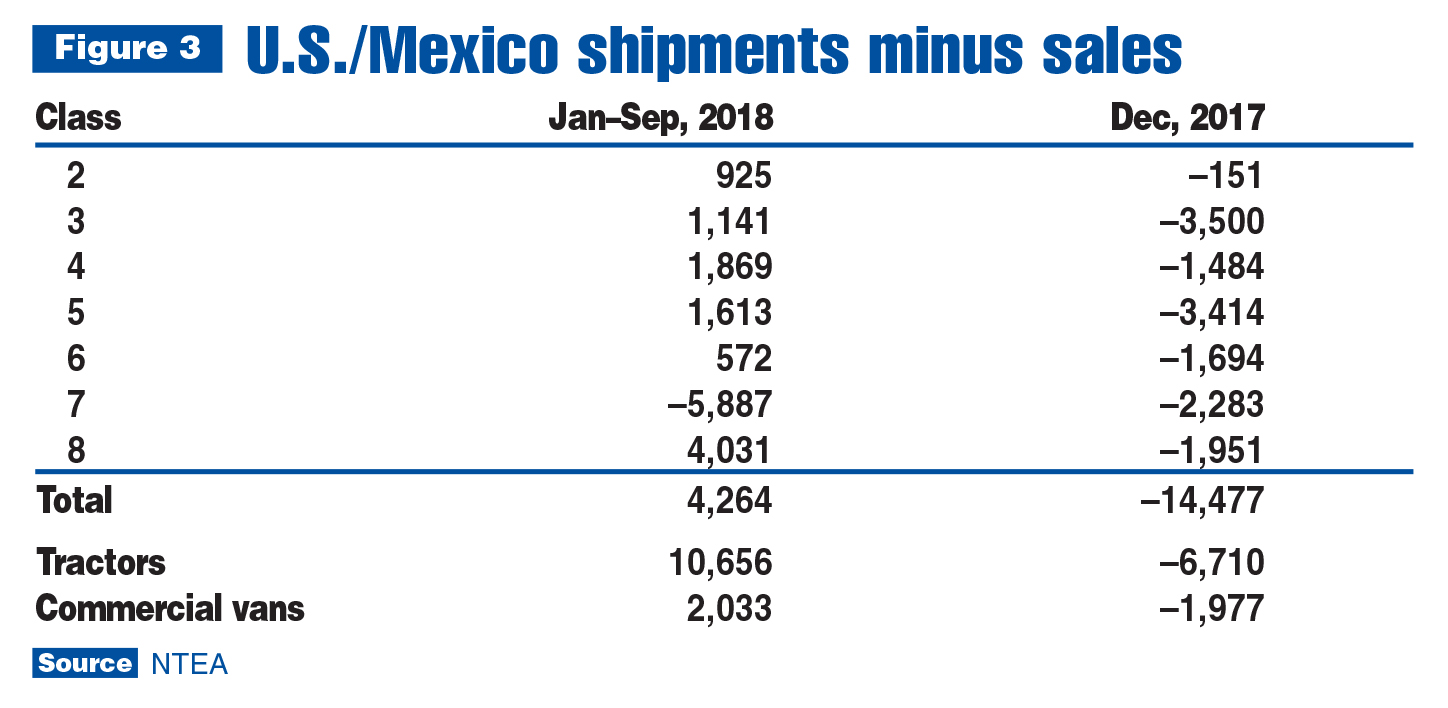
In Classes 2 and 8, shipments will probably remain higher than sales at year-end. In all the other classes, due to December plant shutdowns and year-end sales incentives, sales will likely surge ahead of shipments for the year, just as in 2017. As a result, long lead-times will almost certainly remain an issue in 2019, but will vary by cab type/weight class market segment. Classes 5–7 may continue to be most problematic in terms of availability and lead-times.
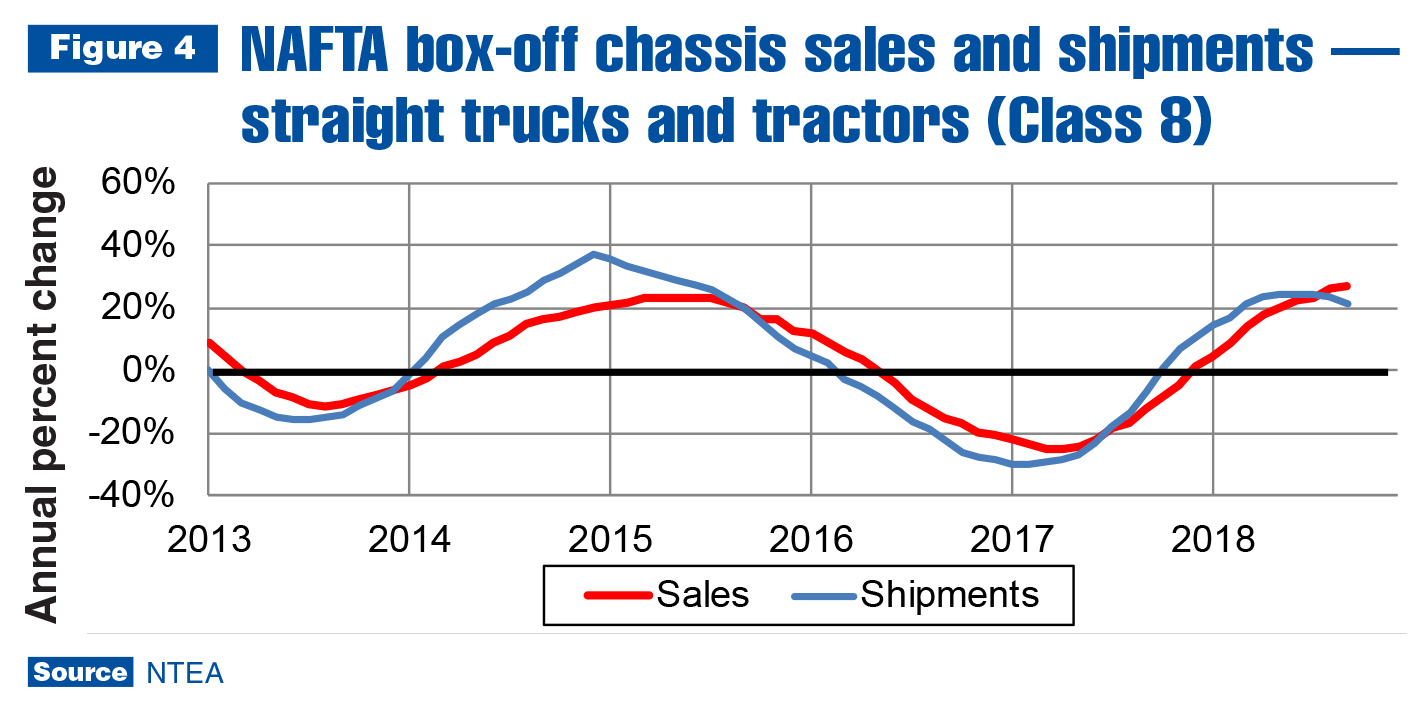
If monthly sales levels are as high in the fourth quarter as throughout the rest of the year, inventory in the tractor segment will continue falling slowly. This trend will likely stretch through 2019. In the commercial van segment (Classes 1–3), the impact of the large 2016–2017 recall has been absorbed, and shipments are catching up with sales. As a result, lead-times may remain stretched in 2019, but not as much as in 2018.
The third quarter was a good time to sell commercial truck chassis and complete vehicles in Canada. Sales increased at a 19.2 percent rate — an improvement from the 2.7 percent decline in the second quarter. Sales rose in all cab-type segments and weight classes, except Classes 2 and 6. Tractor sales jumped 35.8 percent and commercial van sales climbed 27.3 percent.
The 2019 North American work industry forecast remains positive. The labor market may become even tighter in 2019, continuing to negatively impact production, and tariff retaliation could keep disrupting supply chains. Despite that, industry sales are anticipated to increase about 4 percent for the year, with Classes 6–7 expected to grow faster than the rest of the industry.
Metals and energy prices
As shown in Figure 5, prices of steel products have reached new peaks since tariffs were implemented in April, and as of October, were falling on a month-to-month basis. What remains to be seen is if other countries will implement new retaliatory measures. Meetings between the U.S. and China at the November/December G20 Summit could set off a new round of tariff implementation or result in elimination of existing.
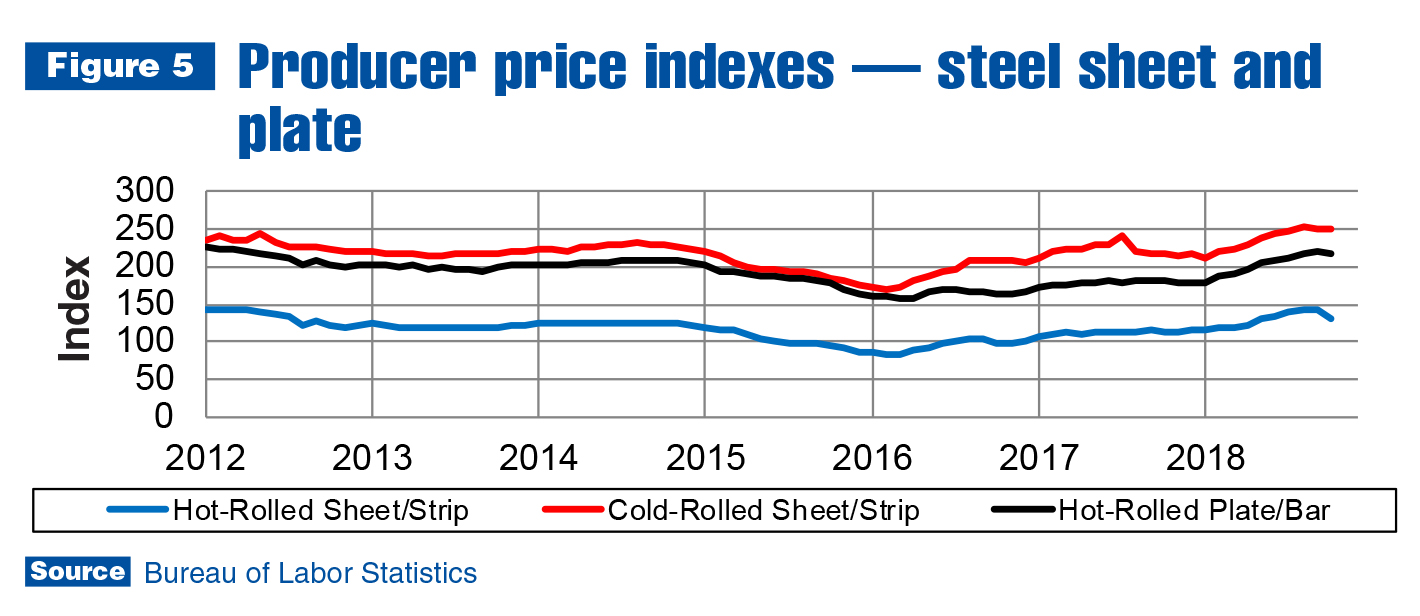
As of October, hot-rolled steel sheet/strip prices were up 16.0 percent for the year, but decreased 6.1 percent in the most recent quarter. Cold-rolled steel sheet/strip prices were 14.9 percent higher for the year, and just 0.9 percent for the most recent quarter. Prices of hot-rolled steel bars/plates/shapes were up 18.8 percent for the year, and 2.0 percent for the last quarter.
In the aluminum industry, the price of sheet fell at a 2.2 percent rate in the most recent quarter, but remained up for the year at an 8.5 percent rate. Scrap prices are down 4.5 percent for the year and 14.8 percent for the most recent quarter — a clear sign aluminum prices peaked.
The price of oil became volatile again in November. The Brent spot price fell from about $70 per barrel at the end of October to around $50 per barrel a month later. Industry analysts speculated the price per barrel would increase to as much as $100 as a result of sanctions on Iran, but when U.S. announced it would grant waivers to eight large buyers of Iranian oil, the global price per barrel started falling immediately.
Politics currently affecting the price of oil may continue to cause volatility in the near term. However, according to U.S. Energy Information Administration (EIA), demand for oil is likely to increase substantially between now and 2025 as the global population and economy grow. It estimates U.S. production would have to increase by 10 million barrels per day to keep up with demand, which seems unlikely given current U.S. production is about 11 million barrels per day.
The other two of the world’s three largest producers, Russia and Saudi Arabia, will also have to commit to major new investments to maintain their shares of global supply in the future. Entering 2019, though, Saudi Arabia is talking about cutting production to bring the global price back up to at least $70 per barrel. This short-term impact on the price of oil will likely be overwhelmed in the long run by forces of supply and demand. EIA’s forecast indicates supply won’t be able to keep pace, and the price will trend up.
Leading indicators
There were about 107,000 housing starts in October — approximately 2,000 units less than October 2017, which pushed the growth rate for the year down to 5.7 percent. This is a little less than forecasted by National Association for Business Economics (NABE) and a little more than the 4.5 percent predicted by National Association of Home Builders. Prices increasing faster than incomes, along with rising interest rates, will likely result in the growth rate falling further by the end of the year.
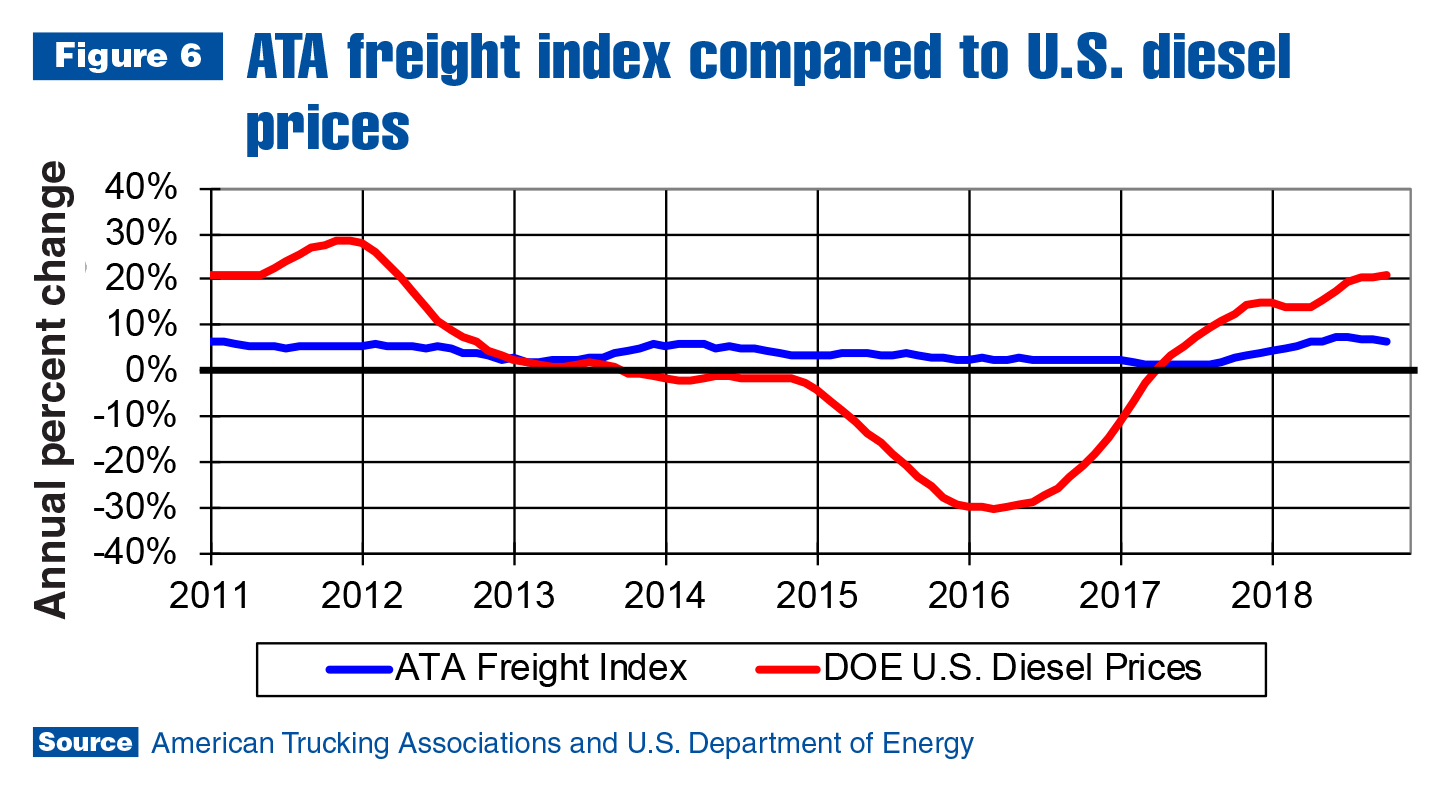
The deceleration of growth in housing starts mirrors that in freight shipments growth, as shown in Figure 6. The American Trucking Associations (ATA) measure of freight shipped in the U.S. clearly peaked in September. ATA’s freight index, which is a reliable indicator of tractor and large trailer sales, is signaling sales in those industry segments could peak in the first half of 2019.
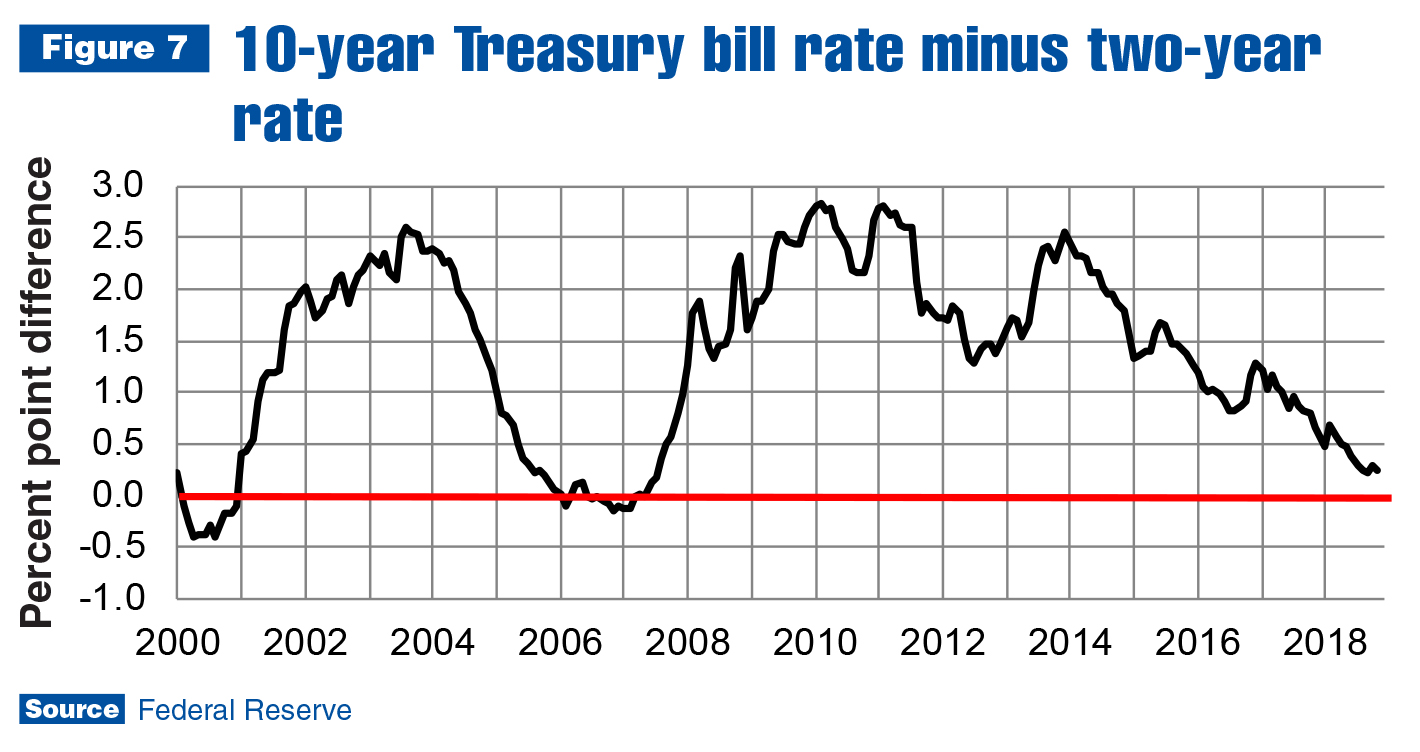
This provides ample support for economic consensus forecasts predicting decelerating U.S. economic growth in 2019. The yield curve also indicates slowing growth. It’s hard to argue otherwise when the labor market is expected to tighten even more in 2019, which will make it difficult to increase production (and you can’t sell products that aren’t produced).
The economy is still creating jobs, though, and low unemployment will likely contribute to historically high consumer confidence. Expenditures on durable goods may slow in 2019, but continue increasing on nondurables and services. Inflation shouldn’t fall to a level that will cause the Fed to loosen monetary policy, which means a probable .25 percentage point increase in December.
Commercial truck and truck equipment sales are expected to keep growing in 2019, but at a slower rate than in 2018. This means companies will likely be planning for more growth in an economy with rising interest rates, increasing inflation and a tighter labor market.
For more industry market data, visit ntea.com/marketdata.